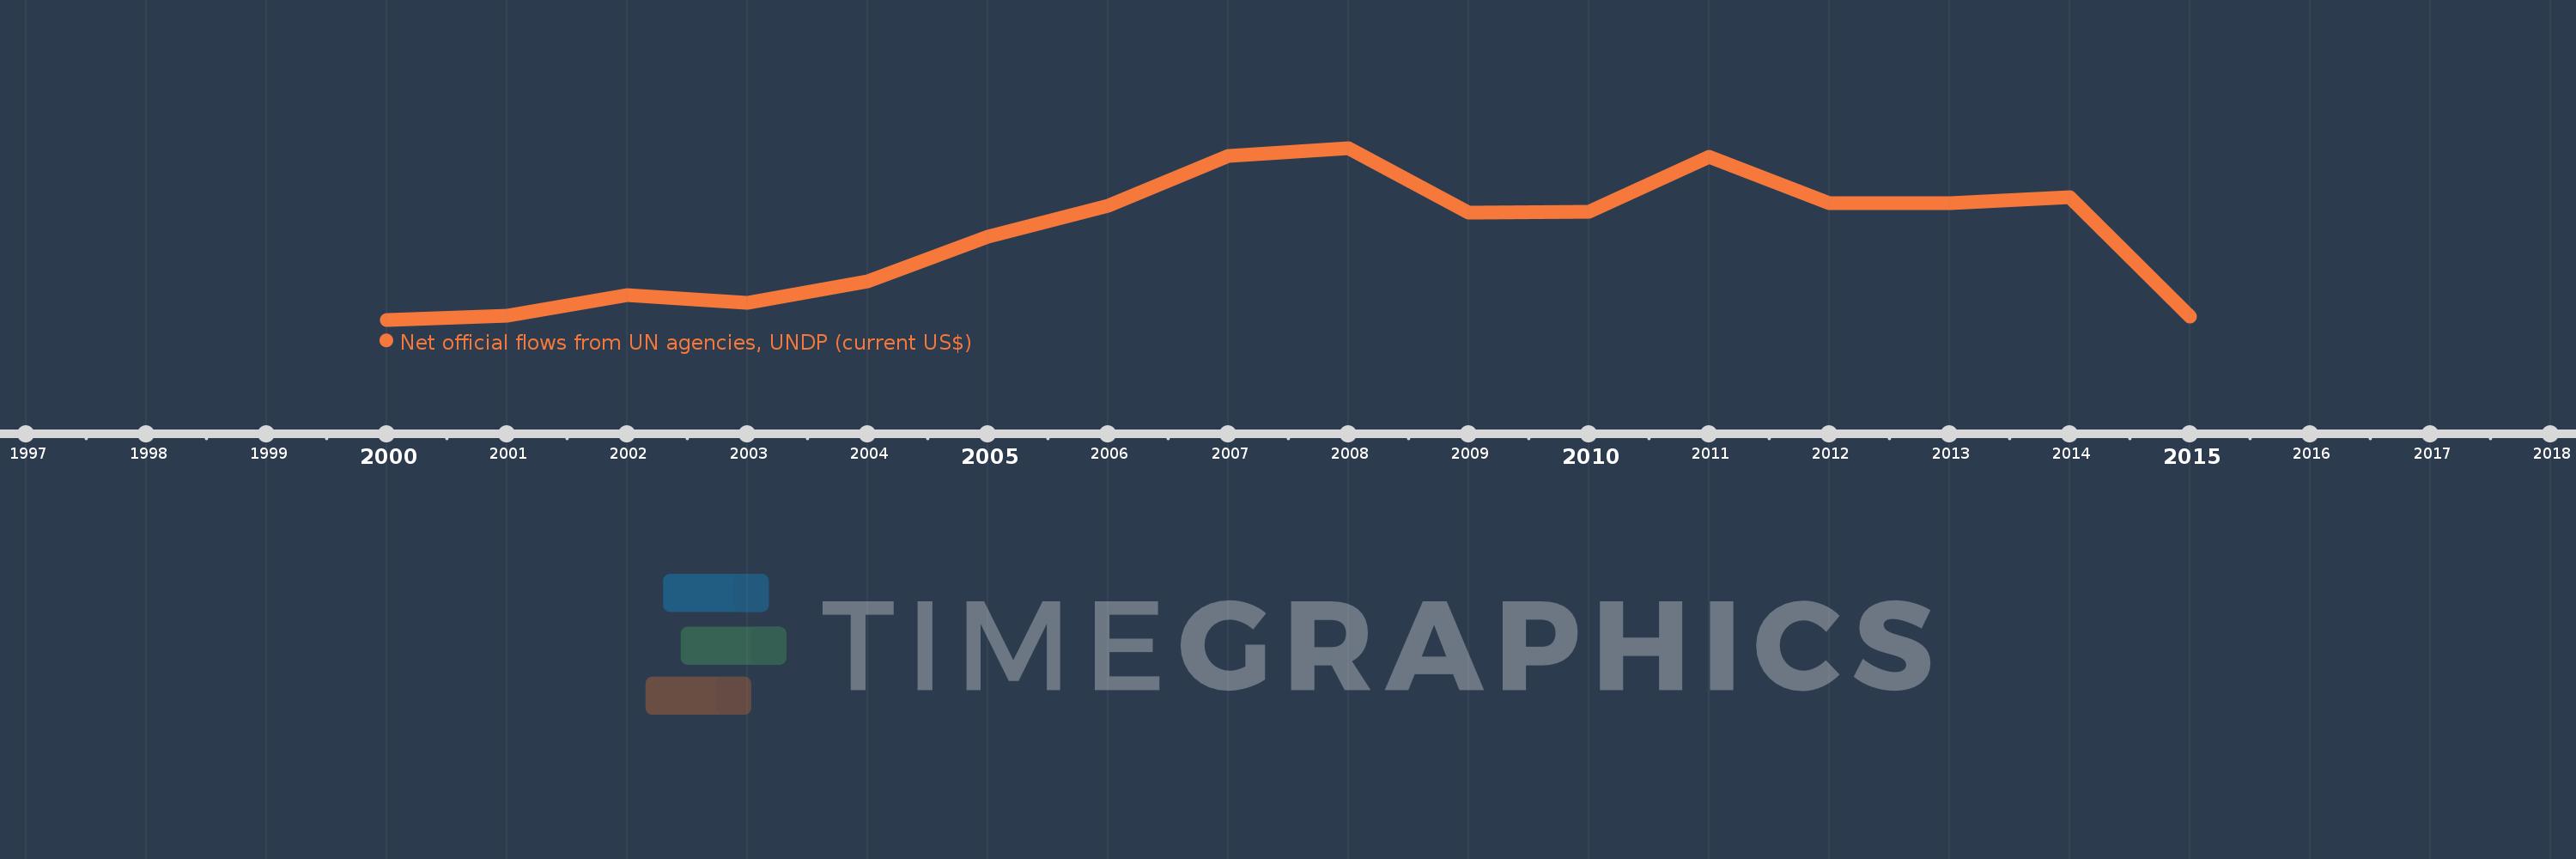
This timeline shows a graph from 2000 to 2015 of Moldova. No data until 1999. Number of actual observations by date: 16.
Source name:
World Development Indicators
Source organization:
Development Assistance Committee of the Organisation for Economic Co-operation and Development, Geographical Distribution of Financial Flows to Developing Countries, Development Co-operation Report, and International Development Statistics database. Data are available online at: www.oecd.org/dac/stats/idsonline.
Categories, topics:
Aid Effectiveness
Last updated:
apr 23, 2017
Indicators value changes by year
Meaning:
1.506 mln
Minimum:
620.0K
jan 1, 2000
Maximum:
2.42 mln
jan 1, 2008
At the date of observation
Value
Absolute change
Change from the previous value
jan 1, 2000
620.0K
+620.0K
0.0%
jan 1, 2001
660.0K
+40.0K
6.45%
jan 1, 2002
880.0K
+220.0K
33.33%
jan 1, 2003
800.0K
-80.0K
-9.09%
jan 1, 2004
1.02 mln
+220.0K
27.5%
jan 1, 2005
1.49 mln
+470.0K
46.08%
jan 1, 2006
1.81 mln
+320.0K
21.48%
jan 1, 2007
2.34 mln
+530.0K
29.28%
jan 1, 2008
2.42 mln
+80.0K
3.42%
jan 1, 2009
1.74 mln
-680.0K
-28.1%
jan 1, 2010
1.75 mln
+10.0K
0.57%
jan 1, 2011
2.33 mln
+580.0K
33.14%
jan 1, 2012
1.84 mln
-490.0K
-21.03%
jan 1, 2013
1.84 mln
0.0
0.0%
jan 1, 2014
1.9 mln
+60.0K
3.26%
jan 1, 2015
650.0K
-1.25 mln
-65.79%
Ranking of countries by current statistics by years