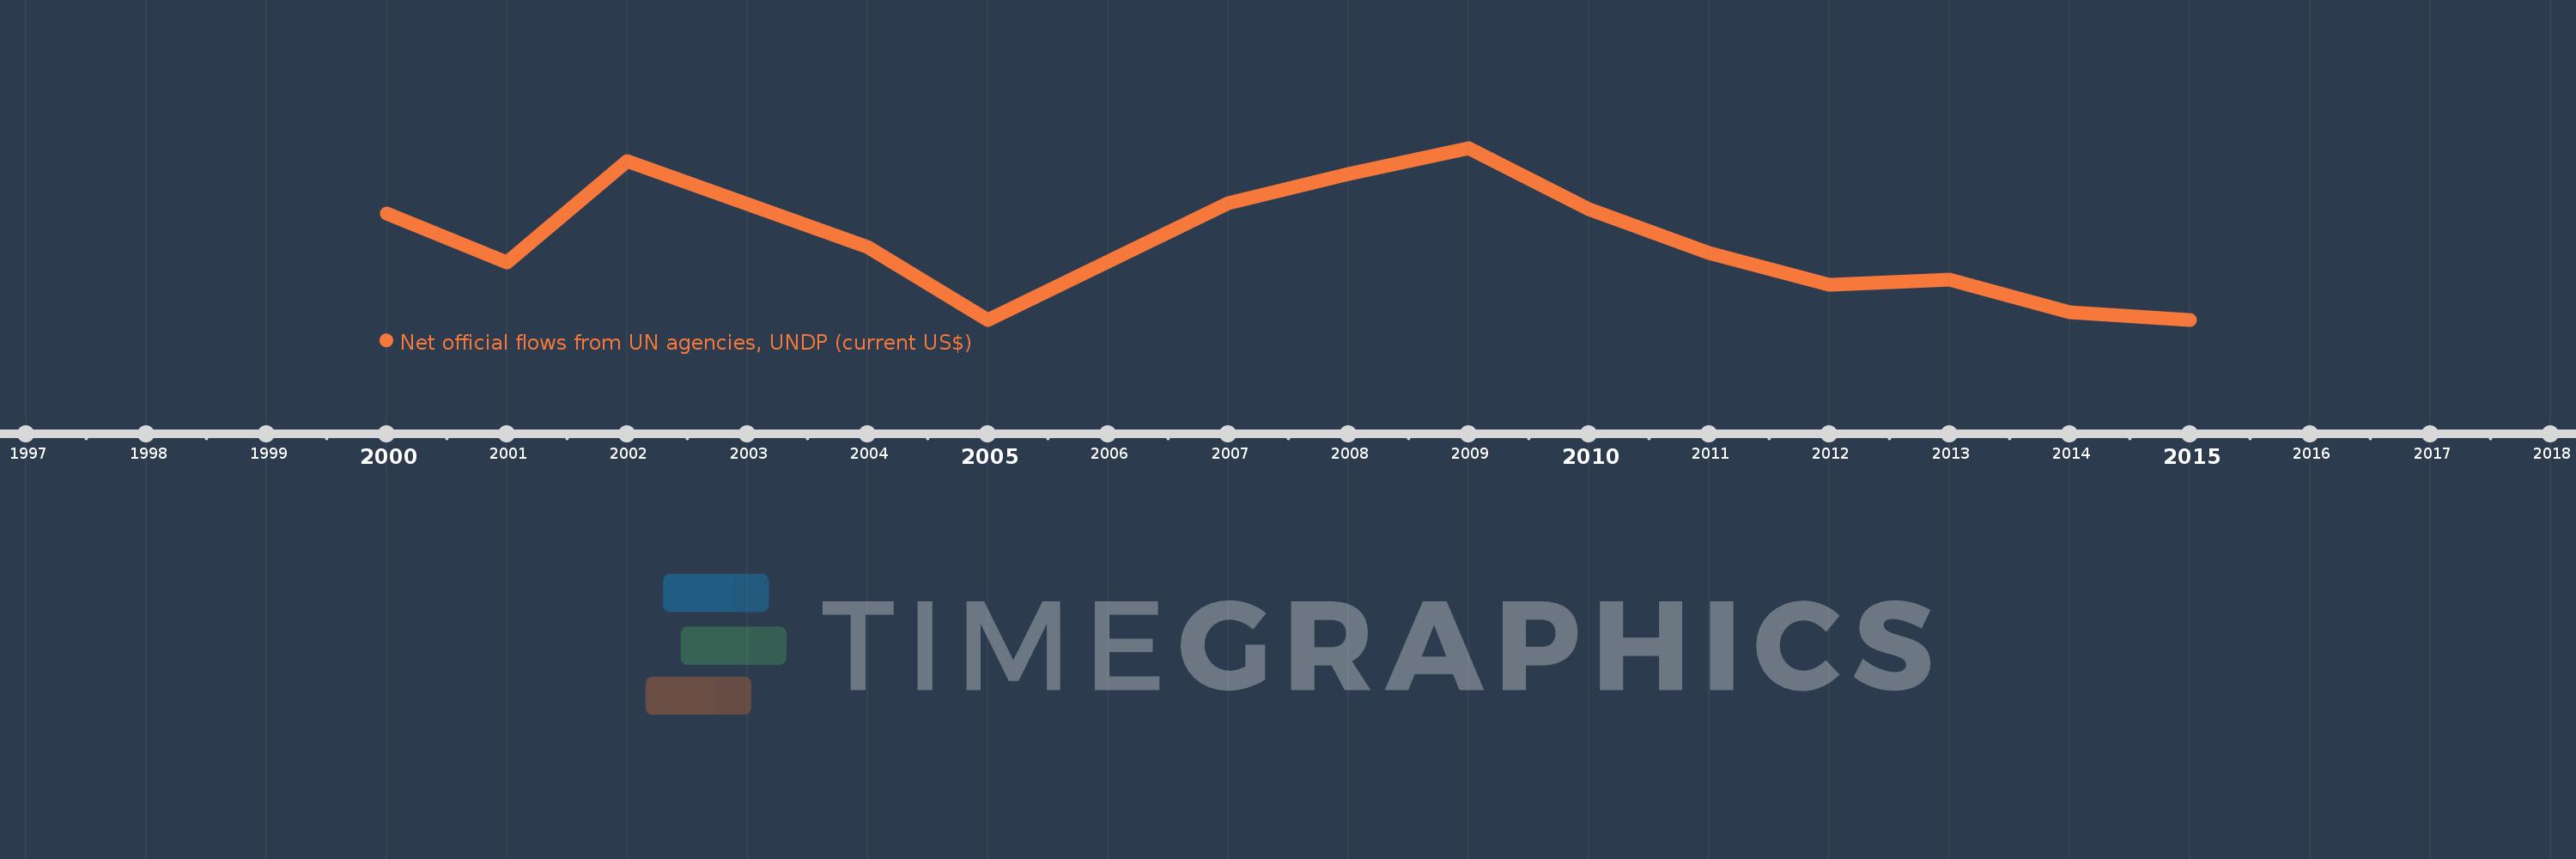
This timeline shows a graph from 2000 to 2015 of Serbia. No data until 1999. Number of actual observations by date: 14.
Source name:
World Development Indicators
Source organization:
Development Assistance Committee of the Organisation for Economic Co-operation and Development, Geographical Distribution of Financial Flows to Developing Countries, Development Co-operation Report, and International Development Statistics database. Data are available online at: www.oecd.org/dac/stats/idsonline.
Categories, topics:
Aid Effectiveness
Last updated:
apr 23, 2017
Indicators value changes by year
Meaning:
1.167 mln
Minimum:
560.0K
jan 1, 2005
Maximum:
1.9 mln
jan 1, 2009
At the date of observation
Value
Absolute change
Change from the previous value
jan 1, 2000
1.39 mln
+1.39 mln
0.0%
jan 1, 2001
1.01 mln
-380.0K
-27.34%
jan 1, 2002
1.8 mln
+790.0K
78.22%
jan 1, 2004
1.13 mln
-670.0K
-37.22%
jan 1, 2005
560.0K
-570.0K
-50.44%
jan 1, 2007
1.47 mln
+910.0K
162.5%
jan 1, 2008
1.7 mln
+230.0K
15.65%
jan 1, 2009
1.9 mln
+200.0K
11.76%
jan 1, 2010
1.42 mln
-480.0K
-25.26%
jan 1, 2011
1.08 mln
-340.0K
-23.94%
jan 1, 2012
830.0K
-250.0K
-23.15%
jan 1, 2013
870.0K
+40.0K
4.82%
jan 1, 2014
620.0K
-250.0K
-28.74%
jan 1, 2015
560.0K
-60.0K
-9.68%
Ranking of countries by current statistics by years