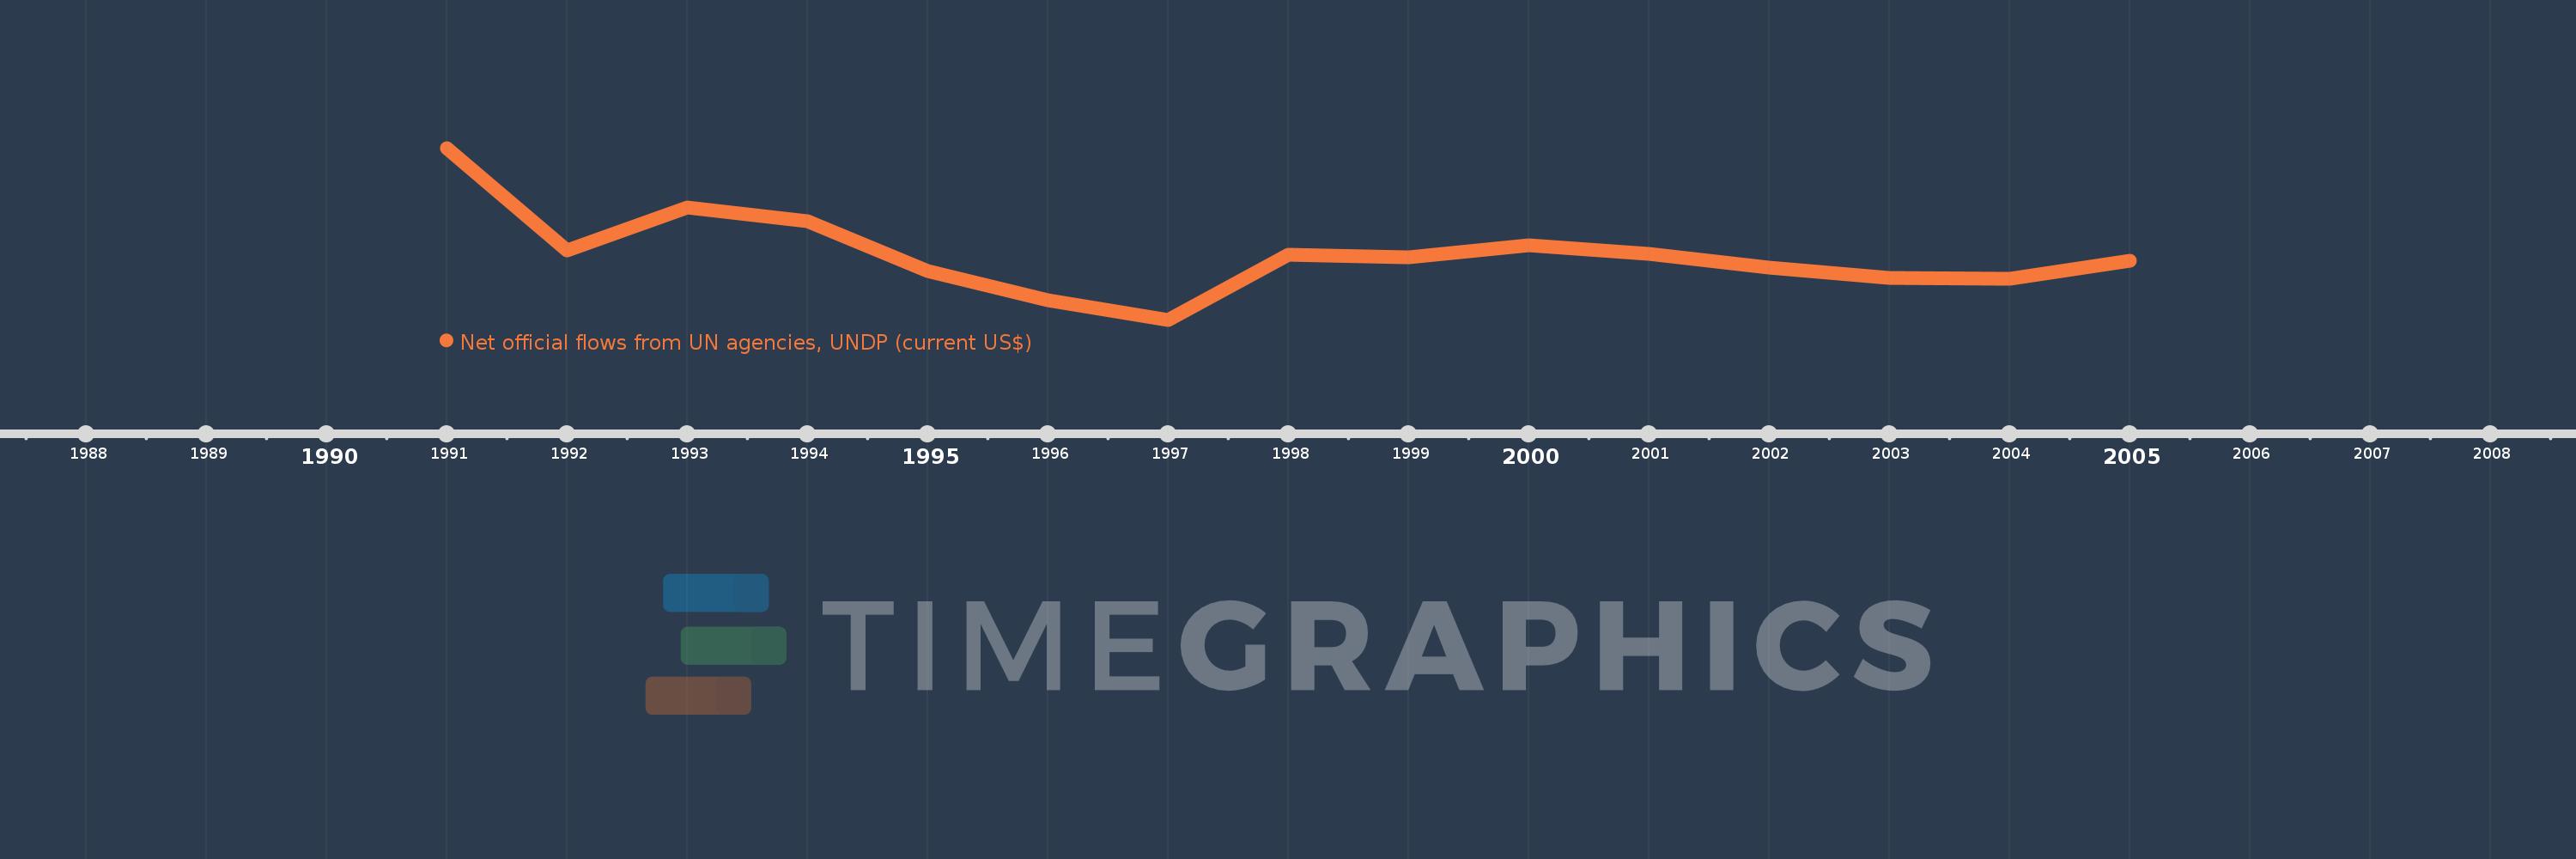
This timeline shows a graph from 1991 to 2005 of Romania. No data until 1990. Number of actual observations by date: 15.
Source name:
World Development Indicators
Source organization:
Development Assistance Committee of the Organisation for Economic Co-operation and Development, Geographical Distribution of Financial Flows to Developing Countries, Development Co-operation Report, and International Development Statistics database. Data are available online at: www.oecd.org/dac/stats/idsonline.
Categories, topics:
Aid Effectiveness
Last updated:
apr 23, 2017
Indicators value changes by year
Meaning:
716.0K
Minimum:
110.0K
jan 1, 1997
Maximum:
1.7 mln
jan 1, 1991
At the date of observation
Value
Absolute change
Change from the previous value
jan 1, 1991
1.7 mln
+1.7 mln
0.0%
jan 1, 1992
750.0K
-950.0K
-55.88%
jan 1, 1993
1.15 mln
+400.0K
53.33%
jan 1, 1994
1.02 mln
-130.0K
-11.3%
jan 1, 1995
560.0K
-460.0K
-45.1%
jan 1, 1996
290.0K
-270.0K
-48.21%
jan 1, 1997
110.0K
-180.0K
-62.07%
jan 1, 1998
710.0K
+600.0K
545.45%
jan 1, 1999
690.0K
-20.0K
-2.82%
jan 1, 2000
800.0K
+110.0K
15.94%
jan 1, 2001
720.0K
-80.0K
-10.0%
jan 1, 2002
590.0K
-130.0K
-18.06%
jan 1, 2003
500.0K
-90.0K
-15.25%
jan 1, 2004
490.0K
-10.0K
-2.0%
jan 1, 2005
660.0K
+170.0K
34.69%
Ranking of countries by current statistics by years