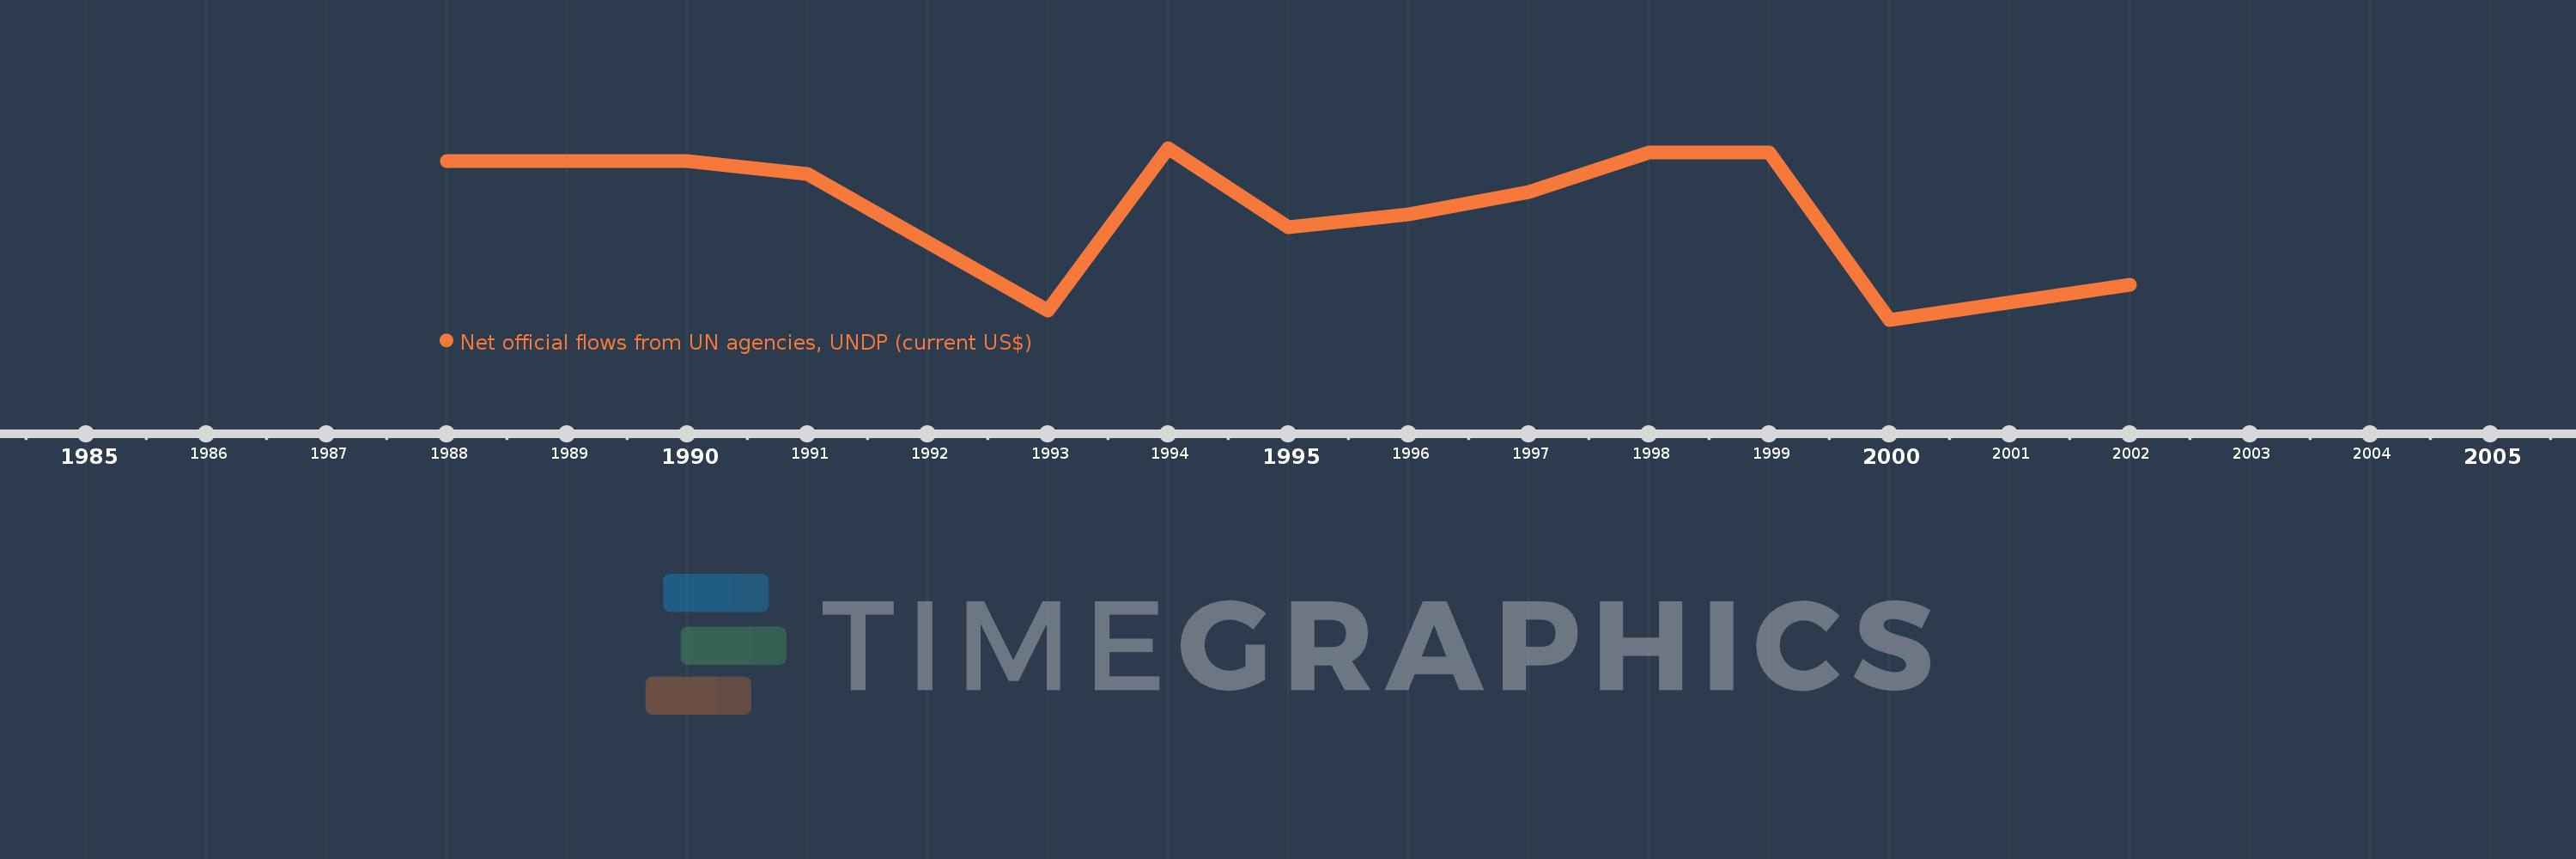
This timeline shows a graph from 1988 to 2002 of Aruba. No data until 1987. Number of actual observations by date: 12.
Source name:
World Development Indicators
Source organization:
Development Assistance Committee of the Organisation for Economic Co-operation and Development, Geographical Distribution of Financial Flows to Developing Countries, Development Co-operation Report, and International Development Statistics database. Data are available online at: www.oecd.org/dac/stats/idsonline.
Categories, topics:
Aid Effectiveness
Last updated:
apr 23, 2017
Indicators value changes by year
Meaning:
-26.667K
Minimum:
-280.0K
jan 1, 2000
Maximum:
110.0K
jan 1, 1994
At the date of observation
Value
Absolute change
Change from the previous value
jan 1, 1988
80.0K
+80.0K
0.0%
jan 1, 1990
80.0K
0.0
0.0%
jan 1, 1991
50.0K
-30.0K
-37.5%
jan 1, 1993
-260.0K
-310.0K
-620.0%
jan 1, 1994
110.0K
+370.0K
-142.31%
jan 1, 1995
-70.0K
-180.0K
-163.64%
jan 1, 1996
-40.0K
+30.0K
-42.86%
jan 1, 1997
10.0K
+50.0K
-125.0%
jan 1, 1998
100.0K
+90.0K
900.0%
jan 1, 1999
100.0K
0.0
0.0%
jan 1, 2000
-280.0K
-380.0K
-380.0%
jan 1, 2002
-200.0K
+80.0K
-28.57%
Ranking of countries by current statistics by years