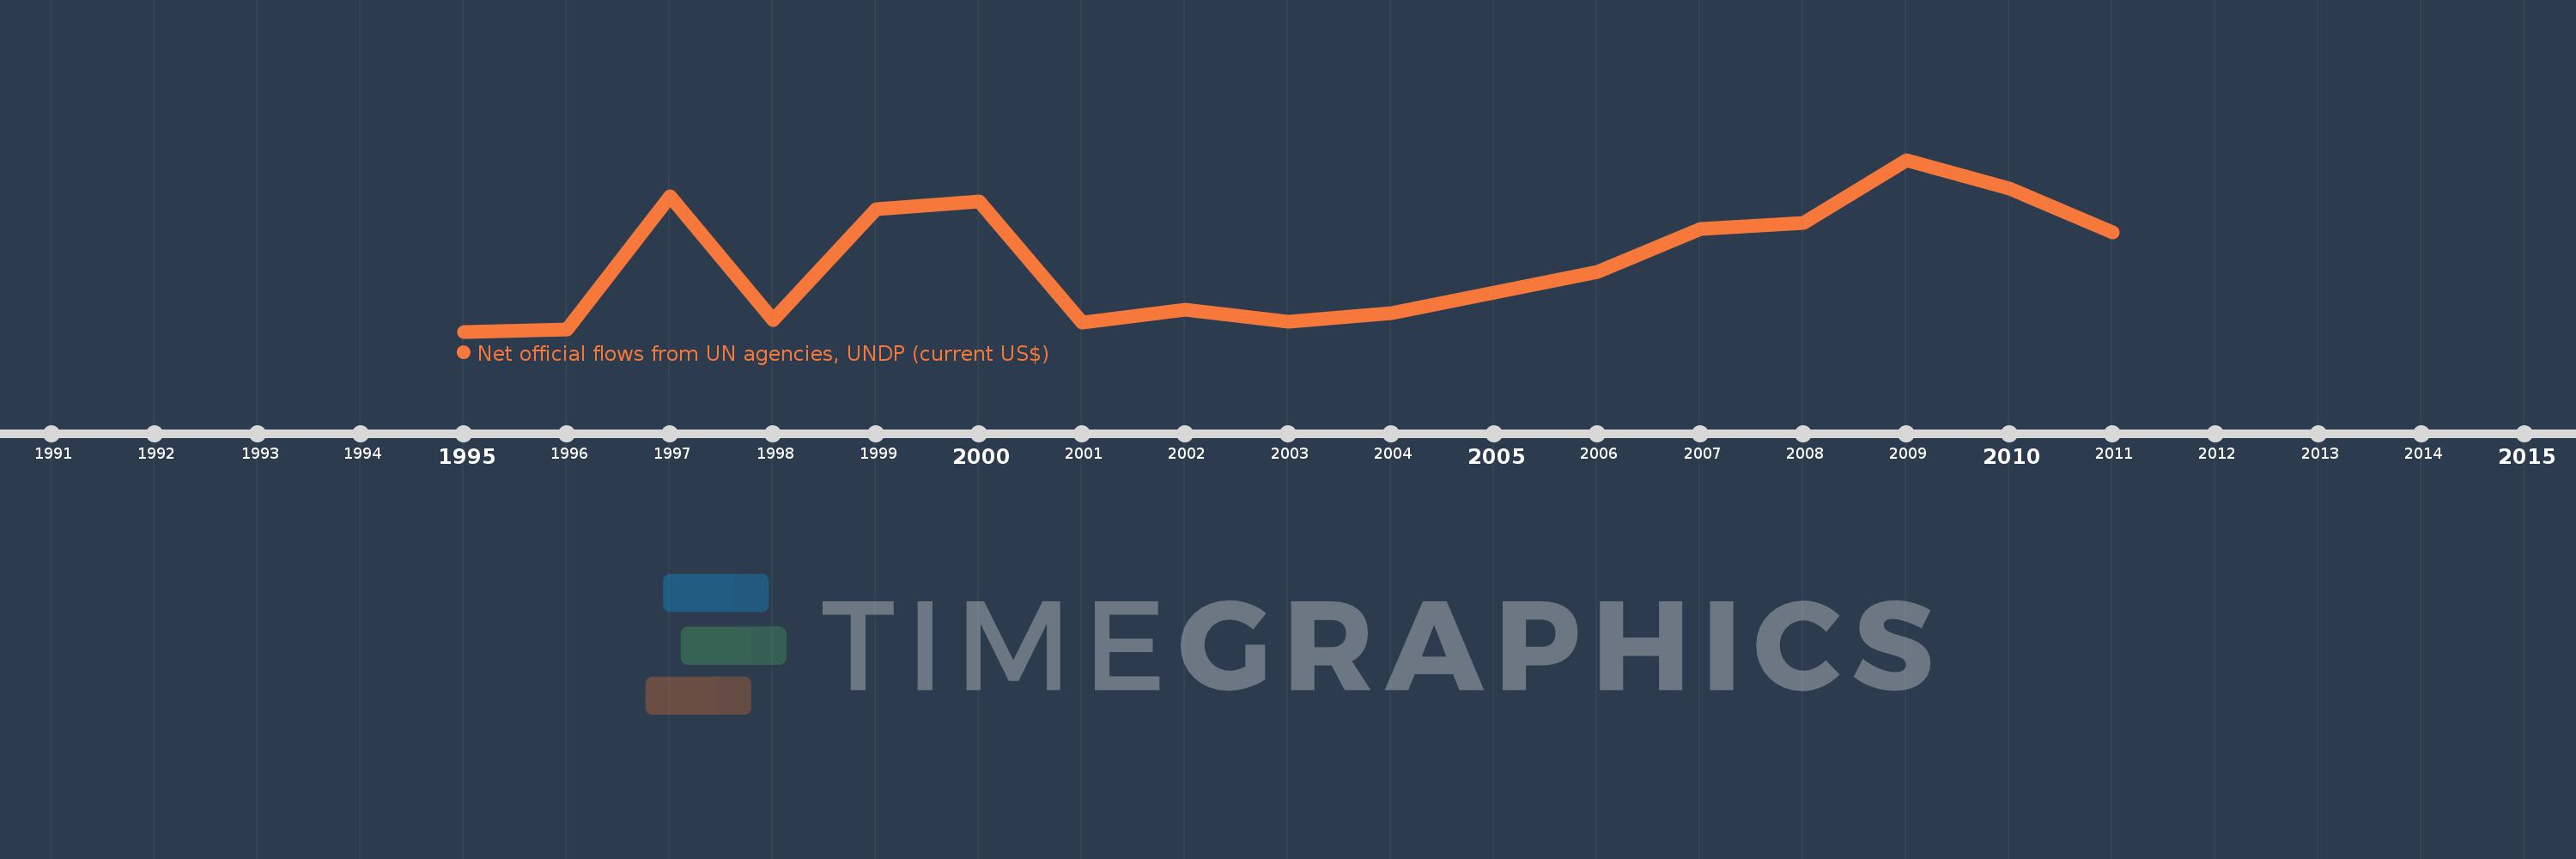
This timeline shows a graph from 1995 to 2011 of Croatia. No data until 1994. Number of actual observations by date: 17.
Source name:
World Development Indicators
Source organization:
Development Assistance Committee of the Organisation for Economic Co-operation and Development, Geographical Distribution of Financial Flows to Developing Countries, Development Co-operation Report, and International Development Statistics database. Data are available online at: www.oecd.org/dac/stats/idsonline.
Categories, topics:
Aid Effectiveness
Last updated:
apr 23, 2017
Indicators value changes by year
Meaning:
639.412K
Minimum:
30.0K
jan 1, 1995
Maximum:
1.53 mln
jan 1, 2009
At the date of observation
Value
Absolute change
Change from the previous value
jan 1, 1995
30.0K
+30.0K
0.0%
jan 1, 1996
50.0K
+20.0K
66.67%
jan 1, 1997
1.21 mln
+1.16 mln
2.32K%
jan 1, 1998
130.0K
-1.08 mln
-89.26%
jan 1, 1999
1.1 mln
+970.0K
746.15%
jan 1, 2000
1.17 mln
+70.0K
6.36%
jan 1, 2001
110.0K
-1.06 mln
-90.6%
jan 1, 2002
220.0K
+110.0K
100.0%
jan 1, 2003
120.0K
-100.0K
-45.45%
jan 1, 2004
190.0K
+70.0K
58.33%
jan 1, 2005
370.0K
+180.0K
94.74%
jan 1, 2006
550.0K
+180.0K
48.65%
jan 1, 2007
930.0K
+380.0K
69.09%
jan 1, 2008
980.0K
+50.0K
5.38%
jan 1, 2009
1.53 mln
+550.0K
56.12%
jan 1, 2010
1.28 mln
-250.0K
-16.34%
jan 1, 2011
900.0K
-380.0K
-29.69%
Ranking of countries by current statistics by years