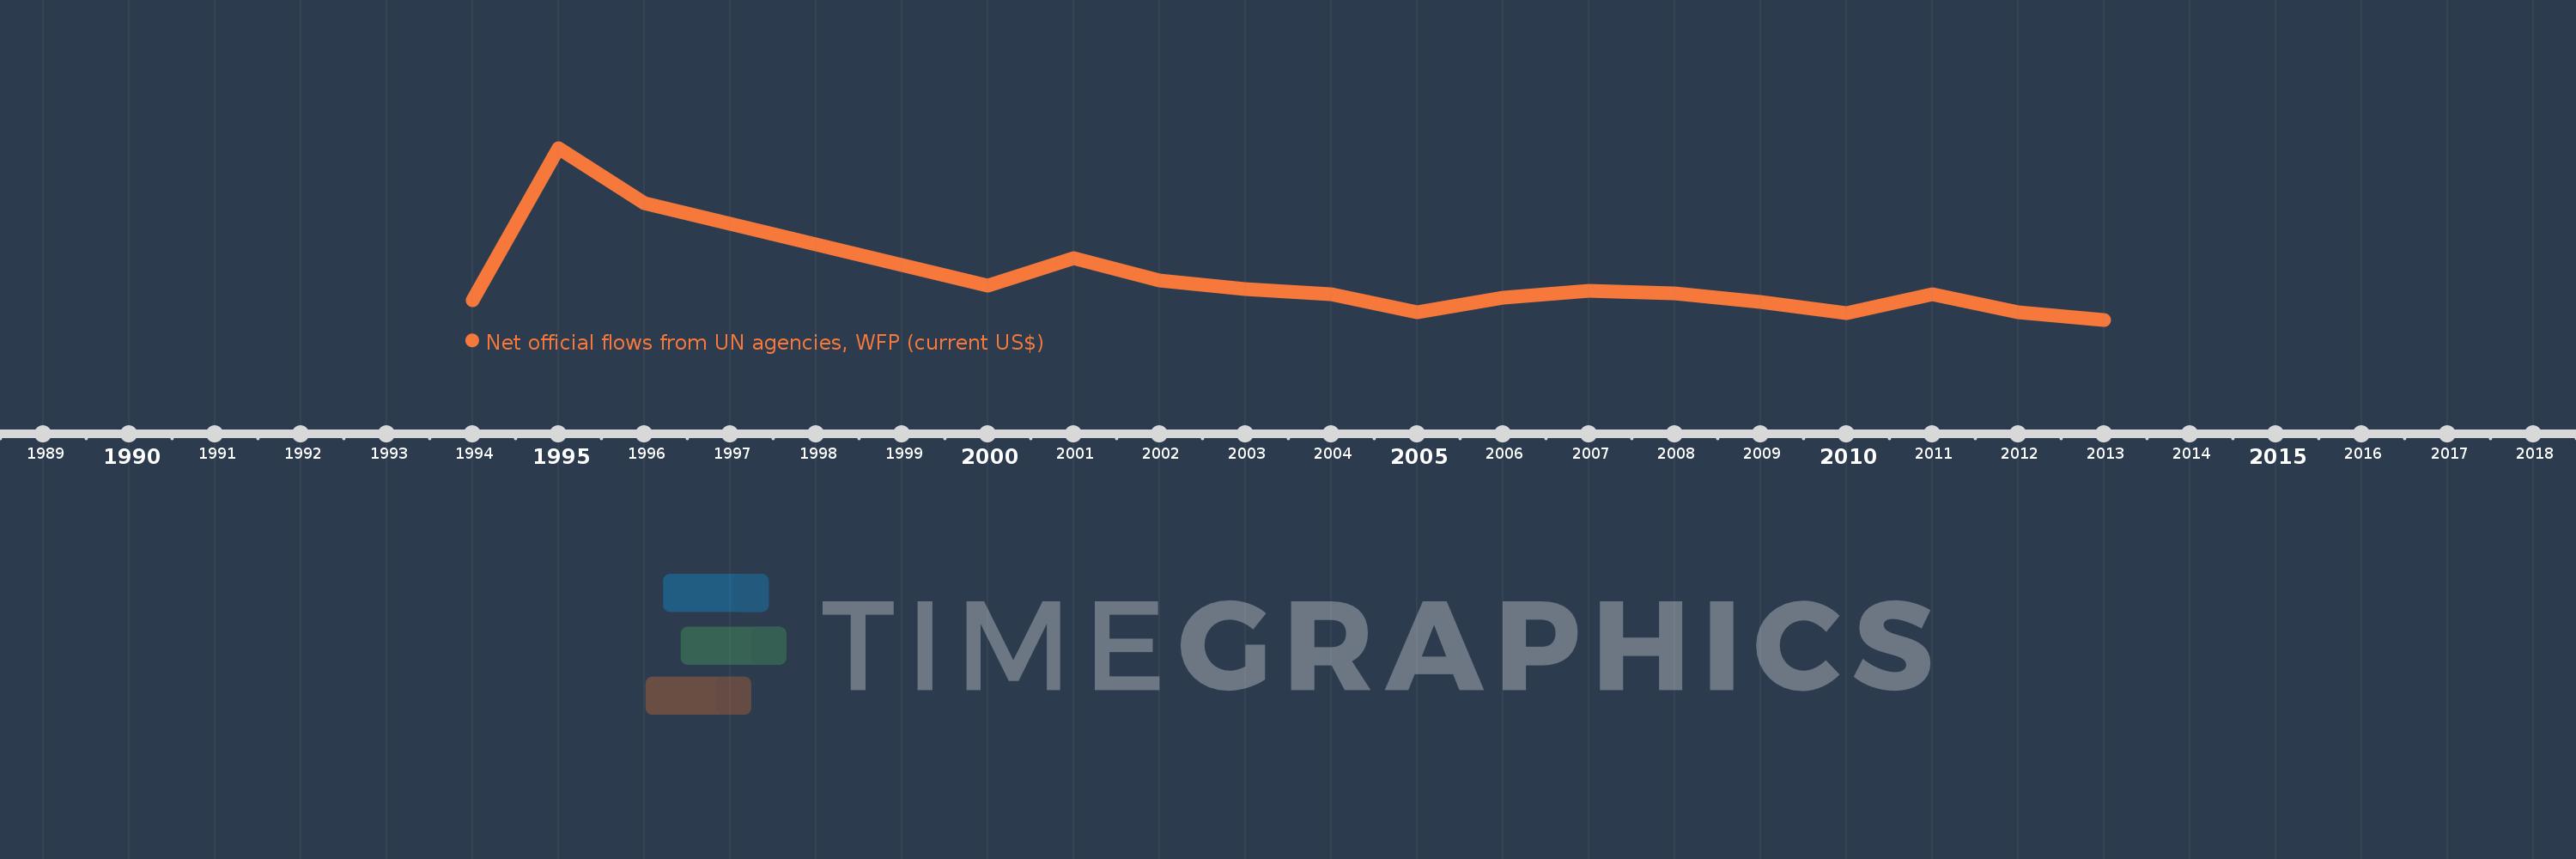
This timeline shows a graph from 1994 to 2013 of Armenia. No data until 1993. Number of actual observations by date: 17.
Source name:
World Development Indicators
Source organization:
Development Assistance Committee of the Organisation for Economic Co-operation and Development, Geographical Distribution of Financial Flows to Developing Countries, Development Co-operation Report, and International Development Statistics database. Data are available online at: www.oecd.org/dac/stats/idsonline.
Categories, topics:
Aid Effectiveness
Last updated:
apr 23, 2017
Indicators value changes by year
Meaning:
1.609 mln
Minimum:
0.0
jan 1, 2013
Maximum:
7.33 mln
jan 1, 1995
At the date of observation
Value
Absolute change
Change from the previous value
jan 1, 1994
840.0K
+840.0K
0.0%
jan 1, 1995
7.33 mln
+6.49 mln
772.62%
jan 1, 1996
4.99 mln
-2.34 mln
-31.92%
jan 1, 2000
1.45 mln
-3.54 mln
-70.94%
jan 1, 2001
2.61 mln
+1.16 mln
80.0%
jan 1, 2002
1.66 mln
-950.0K
-36.4%
jan 1, 2003
1.3 mln
-360.0K
-21.69%
jan 1, 2004
1.08 mln
-220.0K
-16.92%
jan 1, 2005
330.0K
-750.0K
-69.44%
jan 1, 2006
960.0K
+630.0K
190.91%
jan 1, 2007
1.24 mln
+280.0K
29.17%
jan 1, 2008
1.12 mln
-120.0K
-9.68%
jan 1, 2009
770.0K
-350.0K
-31.25%
jan 1, 2010
290.0K
-480.0K
-62.34%
jan 1, 2011
1.08 mln
+790.0K
272.41%
jan 1, 2012
310.0K
-770.0K
-71.3%
jan 1, 2013
0.0
-310.0K
-100.0%
Ranking of countries by current statistics by years