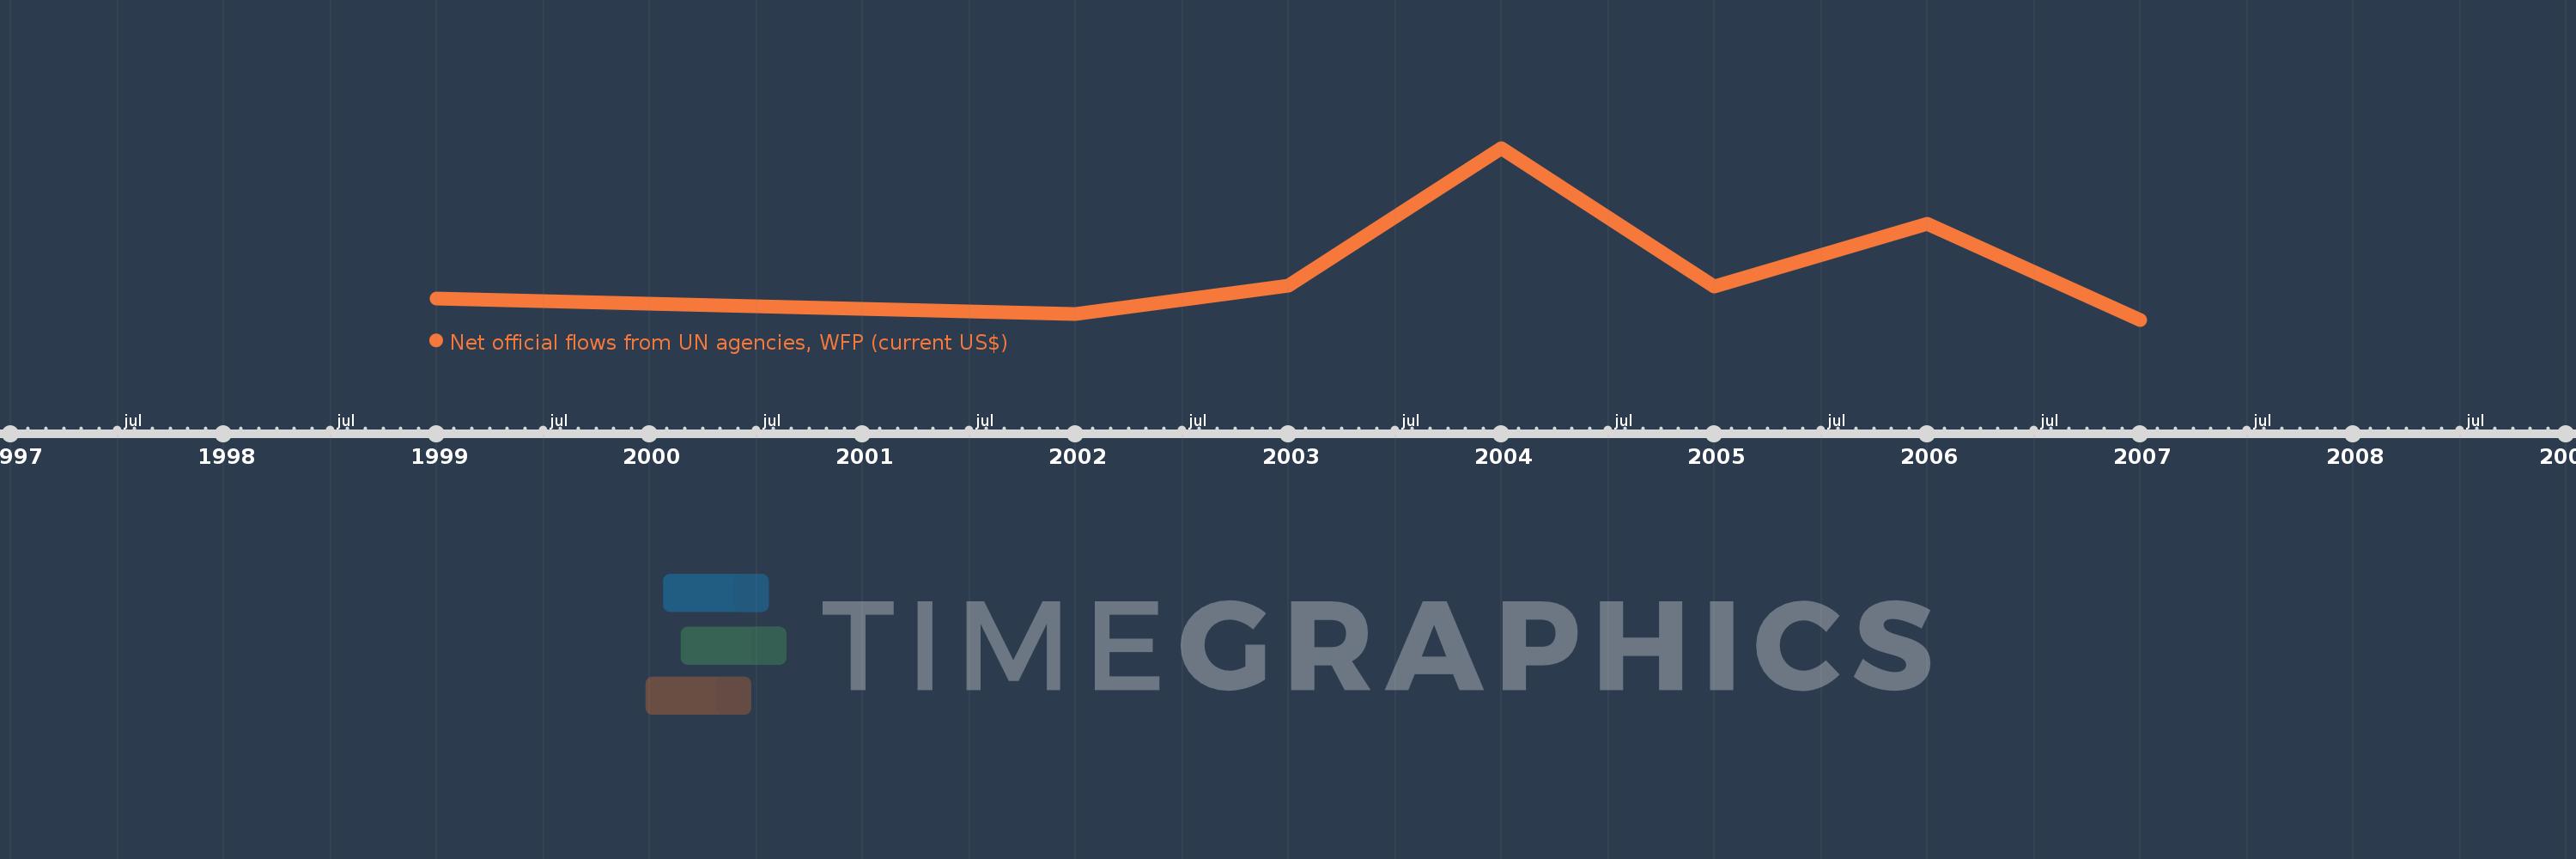
This timeline shows a graph from 1999 to 2007 of Albania. No data until 1998. Number of actual observations by date: 7.
Source name:
World Development Indicators
Source organization:
Development Assistance Committee of the Organisation for Economic Co-operation and Development, Geographical Distribution of Financial Flows to Developing Countries, Development Co-operation Report, and International Development Statistics database. Data are available online at: www.oecd.org/dac/stats/idsonline.
Categories, topics:
Aid Effectiveness
Last updated:
apr 23, 2017
Indicators value changes by year
Meaning:
688.571K
Minimum:
10.0K
jan 1, 2007
Maximum:
2.26 mln
jan 1, 2004
At the date of observation
Value
Absolute change
Change from the previous value
jan 1, 1999
290.0K
+290.0K
0.0%
jan 1, 2002
90.0K
-200.0K
-68.97%
jan 1, 2003
460.0K
+370.0K
411.11%
jan 1, 2004
2.26 mln
+1.8 mln
391.3%
jan 1, 2005
440.0K
-1.82 mln
-80.53%
jan 1, 2006
1.27 mln
+830.0K
188.64%
jan 1, 2007
10.0K
-1.26 mln
-99.21%
Ranking of countries by current statistics by years