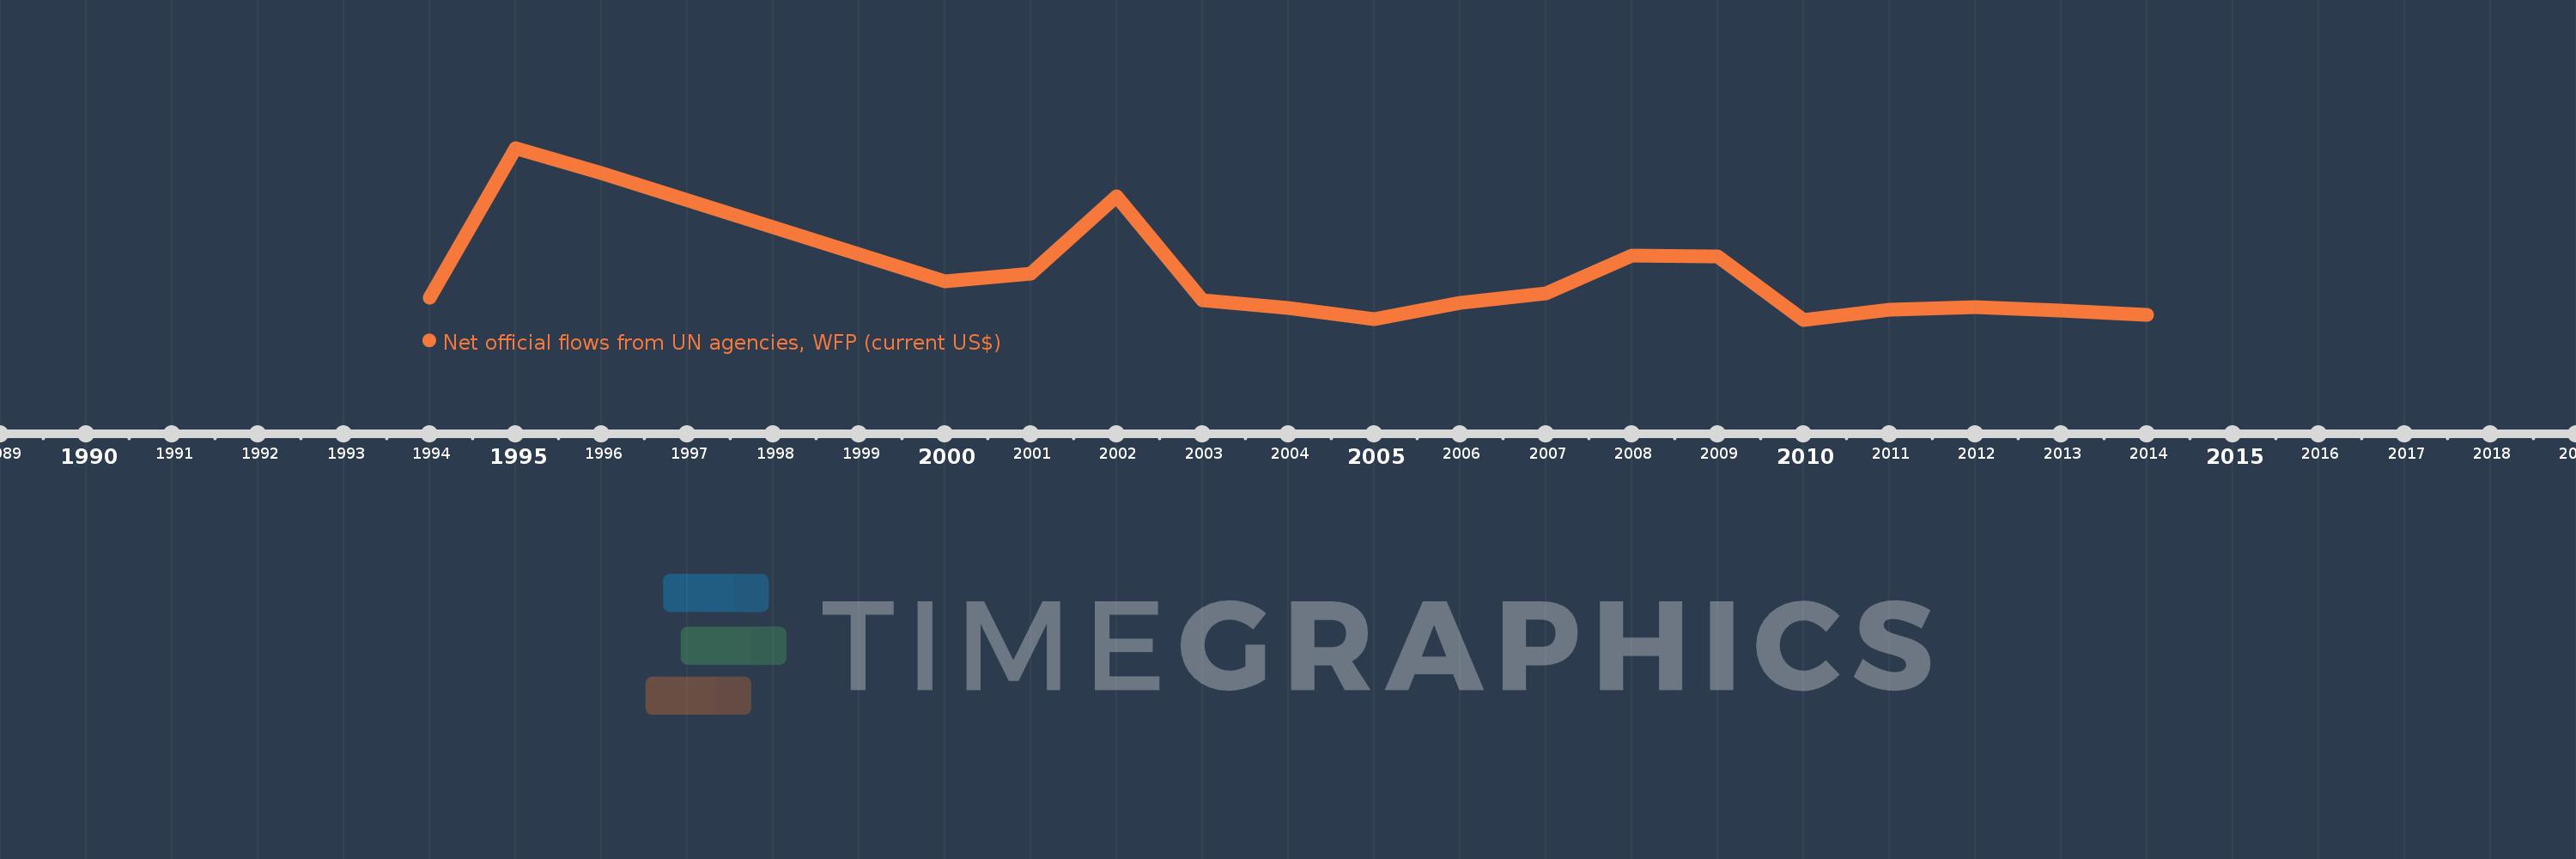
This timeline shows a graph from 1994 to 2014 of Georgia. No data until 1993. Number of actual observations by date: 18.
Source name:
World Development Indicators
Source organization:
Development Assistance Committee of the Organisation for Economic Co-operation and Development, Geographical Distribution of Financial Flows to Developing Countries, Development Co-operation Report, and International Development Statistics database. Data are available online at: www.oecd.org/dac/stats/idsonline.
Categories, topics:
Aid Effectiveness
Last updated:
apr 23, 2017
Indicators value changes by year
Meaning:
1.942 mln
Minimum:
30.0K
jan 1, 2010
Maximum:
7.56 mln
jan 1, 1995
At the date of observation
Value
Absolute change
Change from the previous value
jan 1, 1994
980.0K
+980.0K
0.0%
jan 1, 1995
7.56 mln
+6.58 mln
671.43%
jan 1, 1996
6.44 mln
-1.12 mln
-14.81%
jan 1, 2000
1.7 mln
-4.74 mln
-73.6%
jan 1, 2001
2.04 mln
+340.0K
20.0%
jan 1, 2002
5.44 mln
+3.4 mln
166.67%
jan 1, 2003
890.0K
-4.55 mln
-83.64%
jan 1, 2004
530.0K
-360.0K
-40.45%
jan 1, 2005
40.0K
-490.0K
-92.45%
jan 1, 2006
780.0K
+740.0K
1.85K%
jan 1, 2007
1.17 mln
+390.0K
50.0%
jan 1, 2008
2.84 mln
+1.67 mln
142.74%
jan 1, 2009
2.79 mln
-50.0K
-1.76%
jan 1, 2010
30.0K
-2.76 mln
-98.92%
jan 1, 2011
460.0K
+430.0K
1.43K%
jan 1, 2012
600.0K
+140.0K
30.43%
jan 1, 2013
440.0K
-160.0K
-26.67%
jan 1, 2014
230.0K
-210.0K
-47.73%
Ranking of countries by current statistics by years