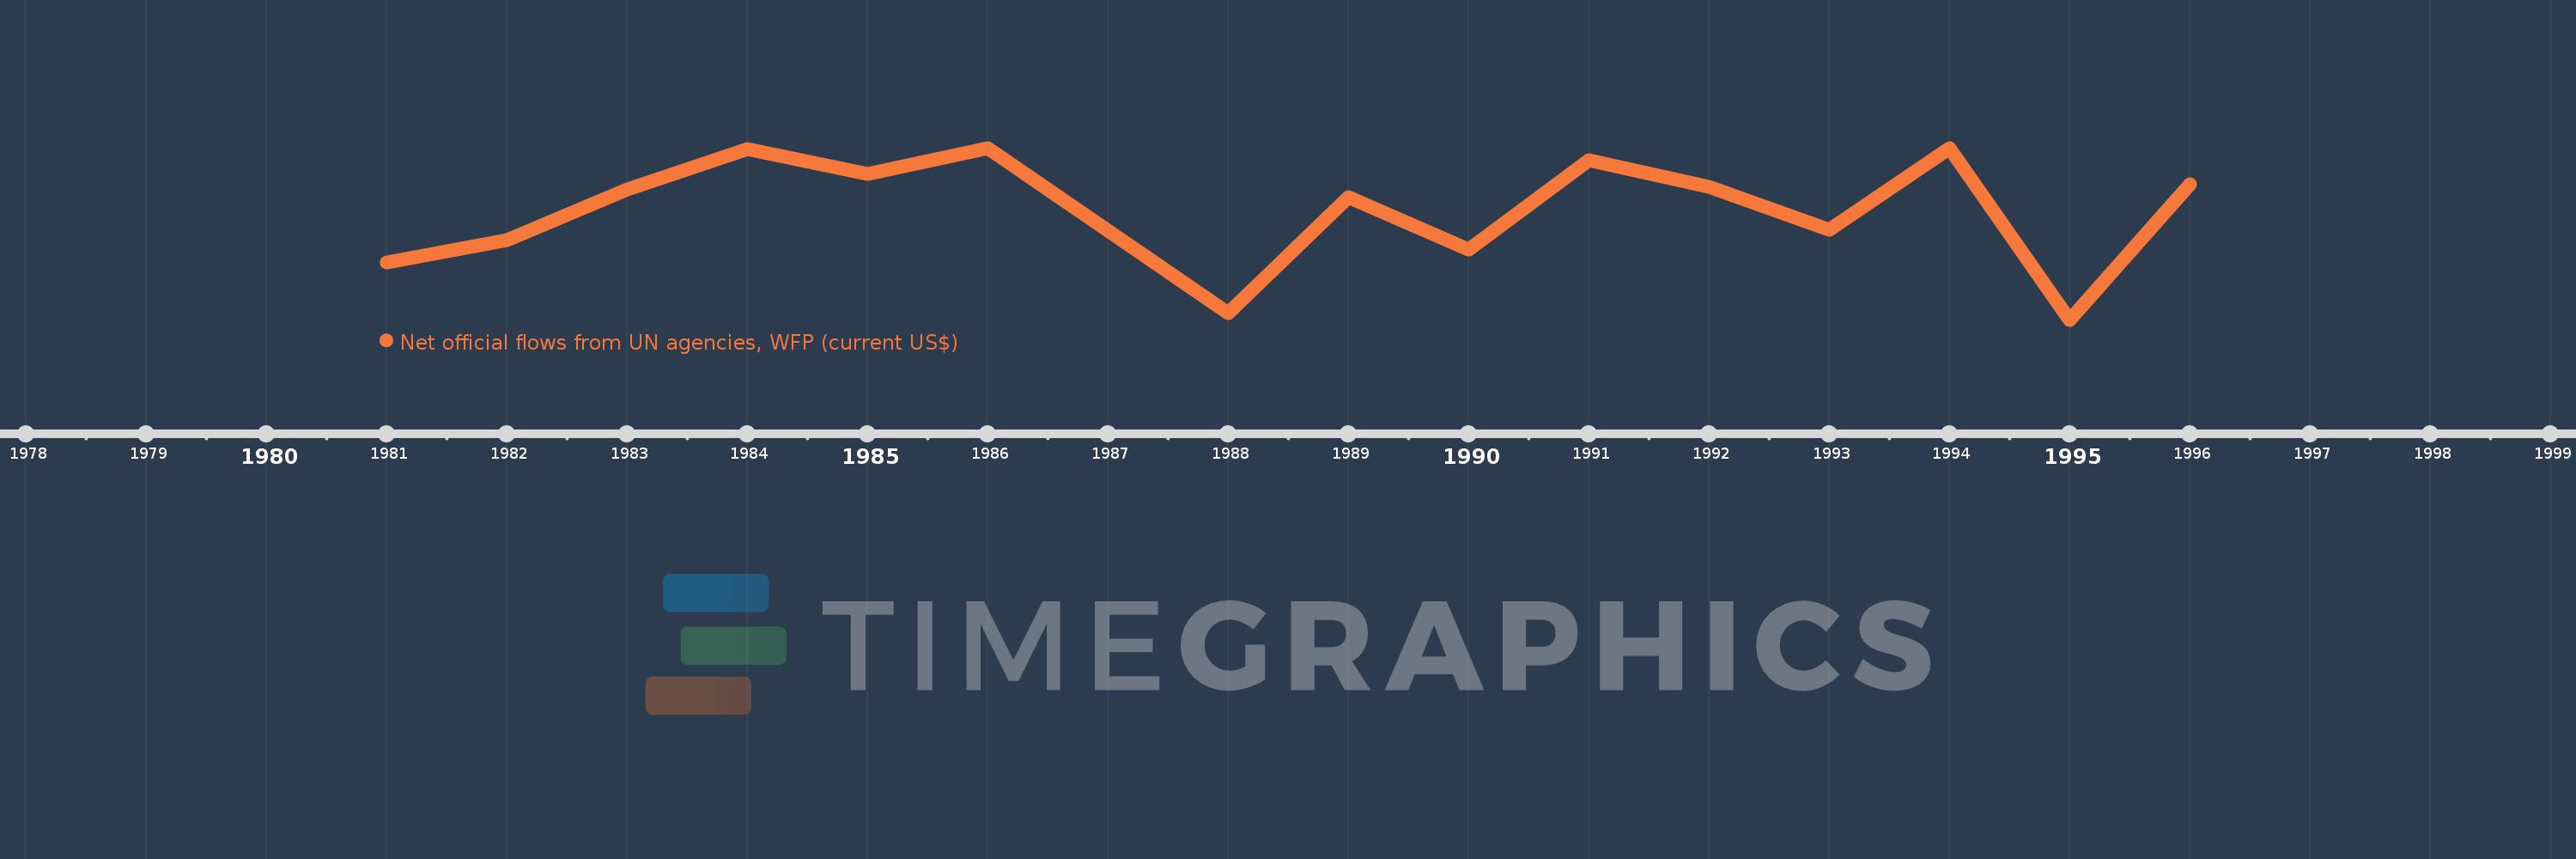
This timeline shows a graph from 1981 to 1996 of Equatorial Guinea. No data until 1980. Number of actual observations by date: 15.
Source name:
World Development Indicators
Source organization:
Development Assistance Committee of the Organisation for Economic Co-operation and Development, Geographical Distribution of Financial Flows to Developing Countries, Development Co-operation Report, and International Development Statistics database. Data are available online at: www.oecd.org/dac/stats/idsonline.
Categories, topics:
Aid Effectiveness
Last updated:
apr 23, 2017
Indicators value changes by year
Meaning:
1.801 mln
Minimum:
-30.0K
jan 1, 1995
Maximum:
2.84 mln
jan 1, 1986
At the date of observation
Value
Absolute change
Change from the previous value
jan 1, 1981
930.0K
+930.0K
0.0%
jan 1, 1982
1.3 mln
+370.0K
39.78%
jan 1, 1983
2.15 mln
+850.0K
65.38%
jan 1, 1984
2.82 mln
+670.0K
31.16%
jan 1, 1985
2.41 mln
-410.0K
-14.54%
jan 1, 1986
2.84 mln
+430.0K
17.84%
jan 1, 1988
80.0K
-2.76 mln
-97.18%
jan 1, 1989
2.02 mln
+1.94 mln
2.42K%
jan 1, 1990
1.14 mln
-880.0K
-43.56%
jan 1, 1991
2.63 mln
+1.49 mln
130.7%
jan 1, 1992
2.19 mln
-440.0K
-16.73%
jan 1, 1993
1.47 mln
-720.0K
-32.88%
jan 1, 1994
2.83 mln
+1.36 mln
92.52%
jan 1, 1995
-30.0K
-2.86 mln
-101.06%
jan 1, 1996
2.24 mln
+2.27 mln
-7.57K%
Ranking of countries by current statistics by years