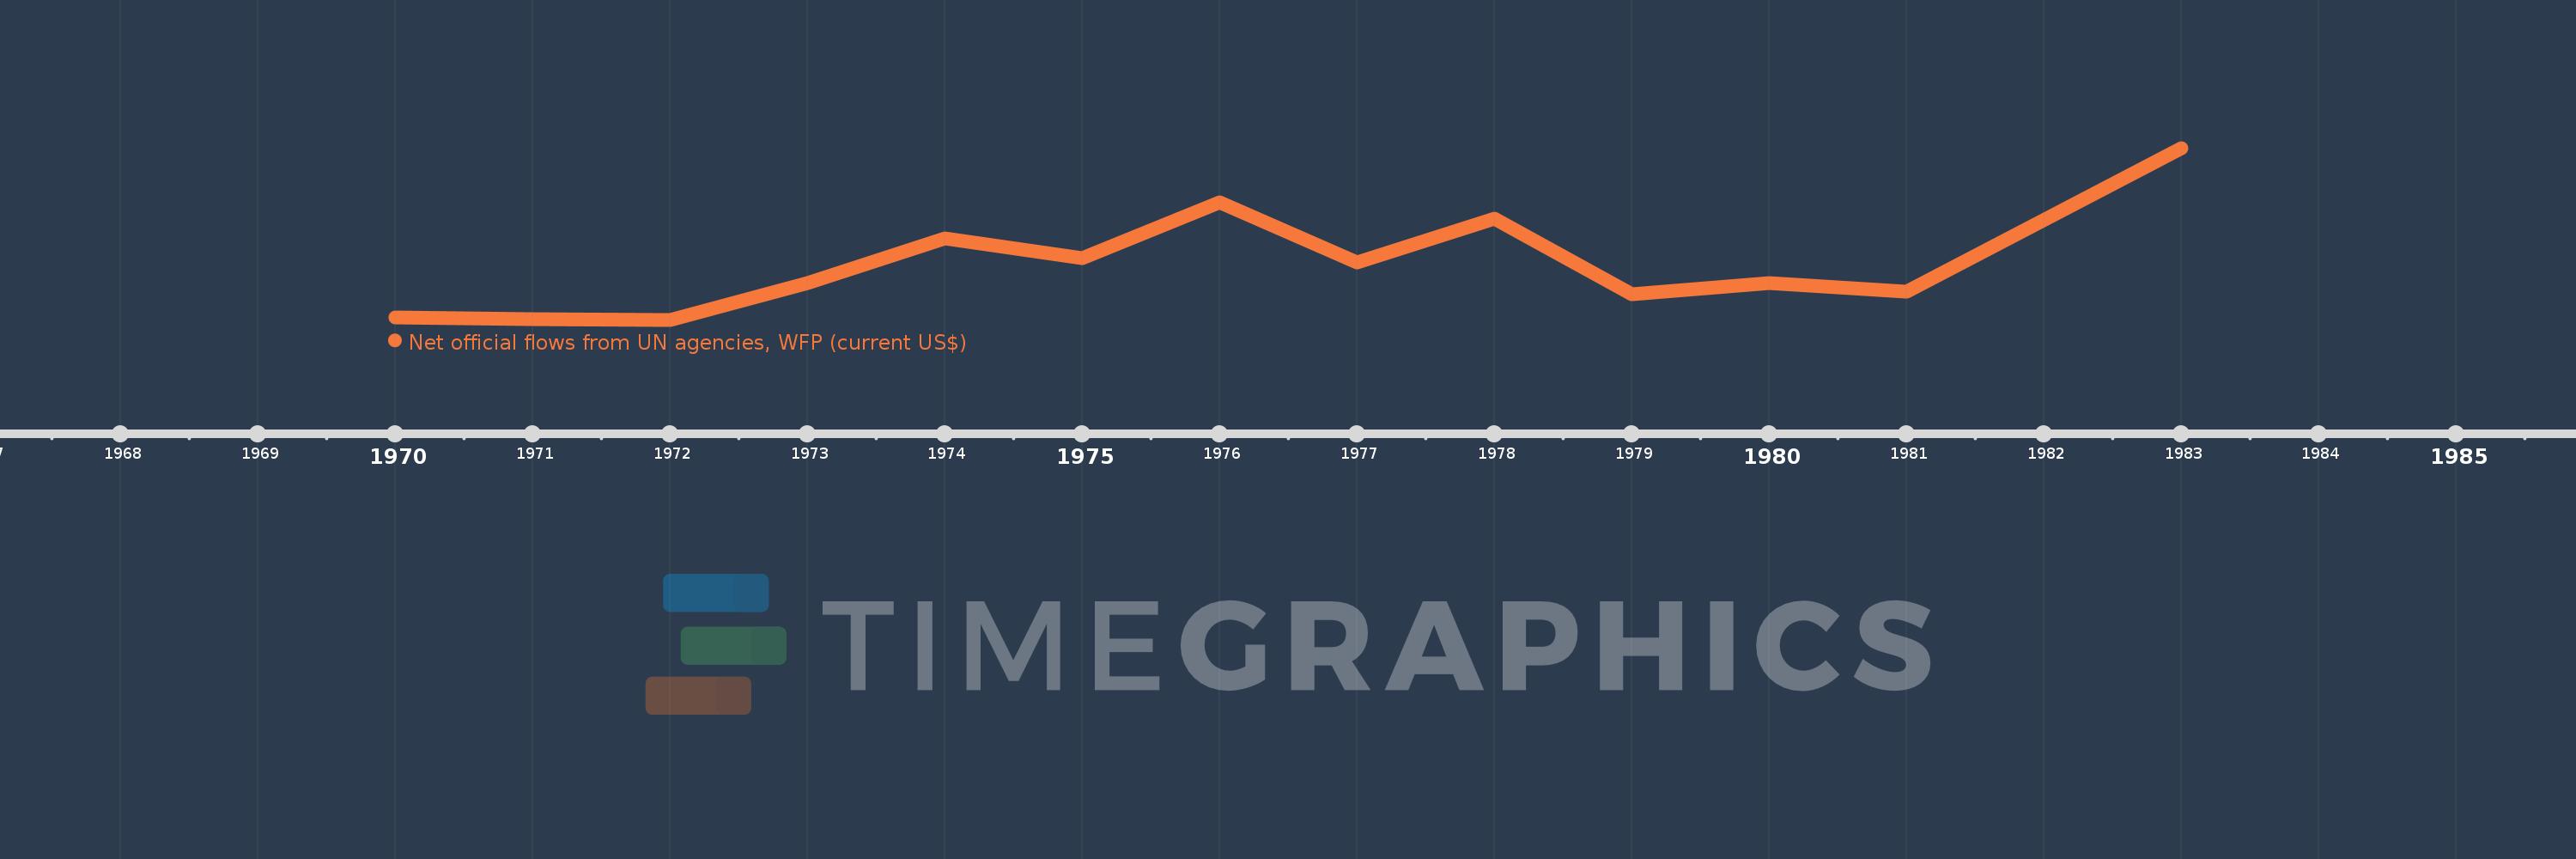
This timeline shows a graph from 1970 to 1983 of Korea, Rep.. No data until 1969. Number of actual observations by date: 13.
Source name:
World Development Indicators
Source organization:
Development Assistance Committee of the Organisation for Economic Co-operation and Development, Geographical Distribution of Financial Flows to Developing Countries, Development Co-operation Report, and International Development Statistics database. Data are available online at: www.oecd.org/dac/stats/idsonline.
Categories, topics:
Aid Effectiveness
Last updated:
apr 23, 2017
Indicators value changes by year
Meaning:
7.577 mln
Minimum:
2.18 mln
jan 1, 1972
Maximum:
18.92 mln
jan 1, 1983
At the date of observation
Value
Absolute change
Change from the previous value
jan 1, 1970
2.44 mln
+2.44 mln
0.0%
jan 1, 1971
2.25 mln
-190.0K
-7.79%
jan 1, 1972
2.18 mln
-70.0K
-3.11%
jan 1, 1973
5.75 mln
+3.57 mln
163.76%
jan 1, 1974
10.08 mln
+4.33 mln
75.3%
jan 1, 1975
8.19 mln
-1.89 mln
-18.75%
jan 1, 1976
13.58 mln
+5.39 mln
65.81%
jan 1, 1977
7.77 mln
-5.81 mln
-42.78%
jan 1, 1978
12.02 mln
+4.25 mln
54.7%
jan 1, 1979
4.68 mln
-7.34 mln
-61.06%
jan 1, 1980
5.74 mln
+1.06 mln
22.65%
jan 1, 1981
4.9 mln
-840.0K
-14.63%
jan 1, 1983
18.92 mln
+14.02 mln
286.12%
Ranking of countries by current statistics by years