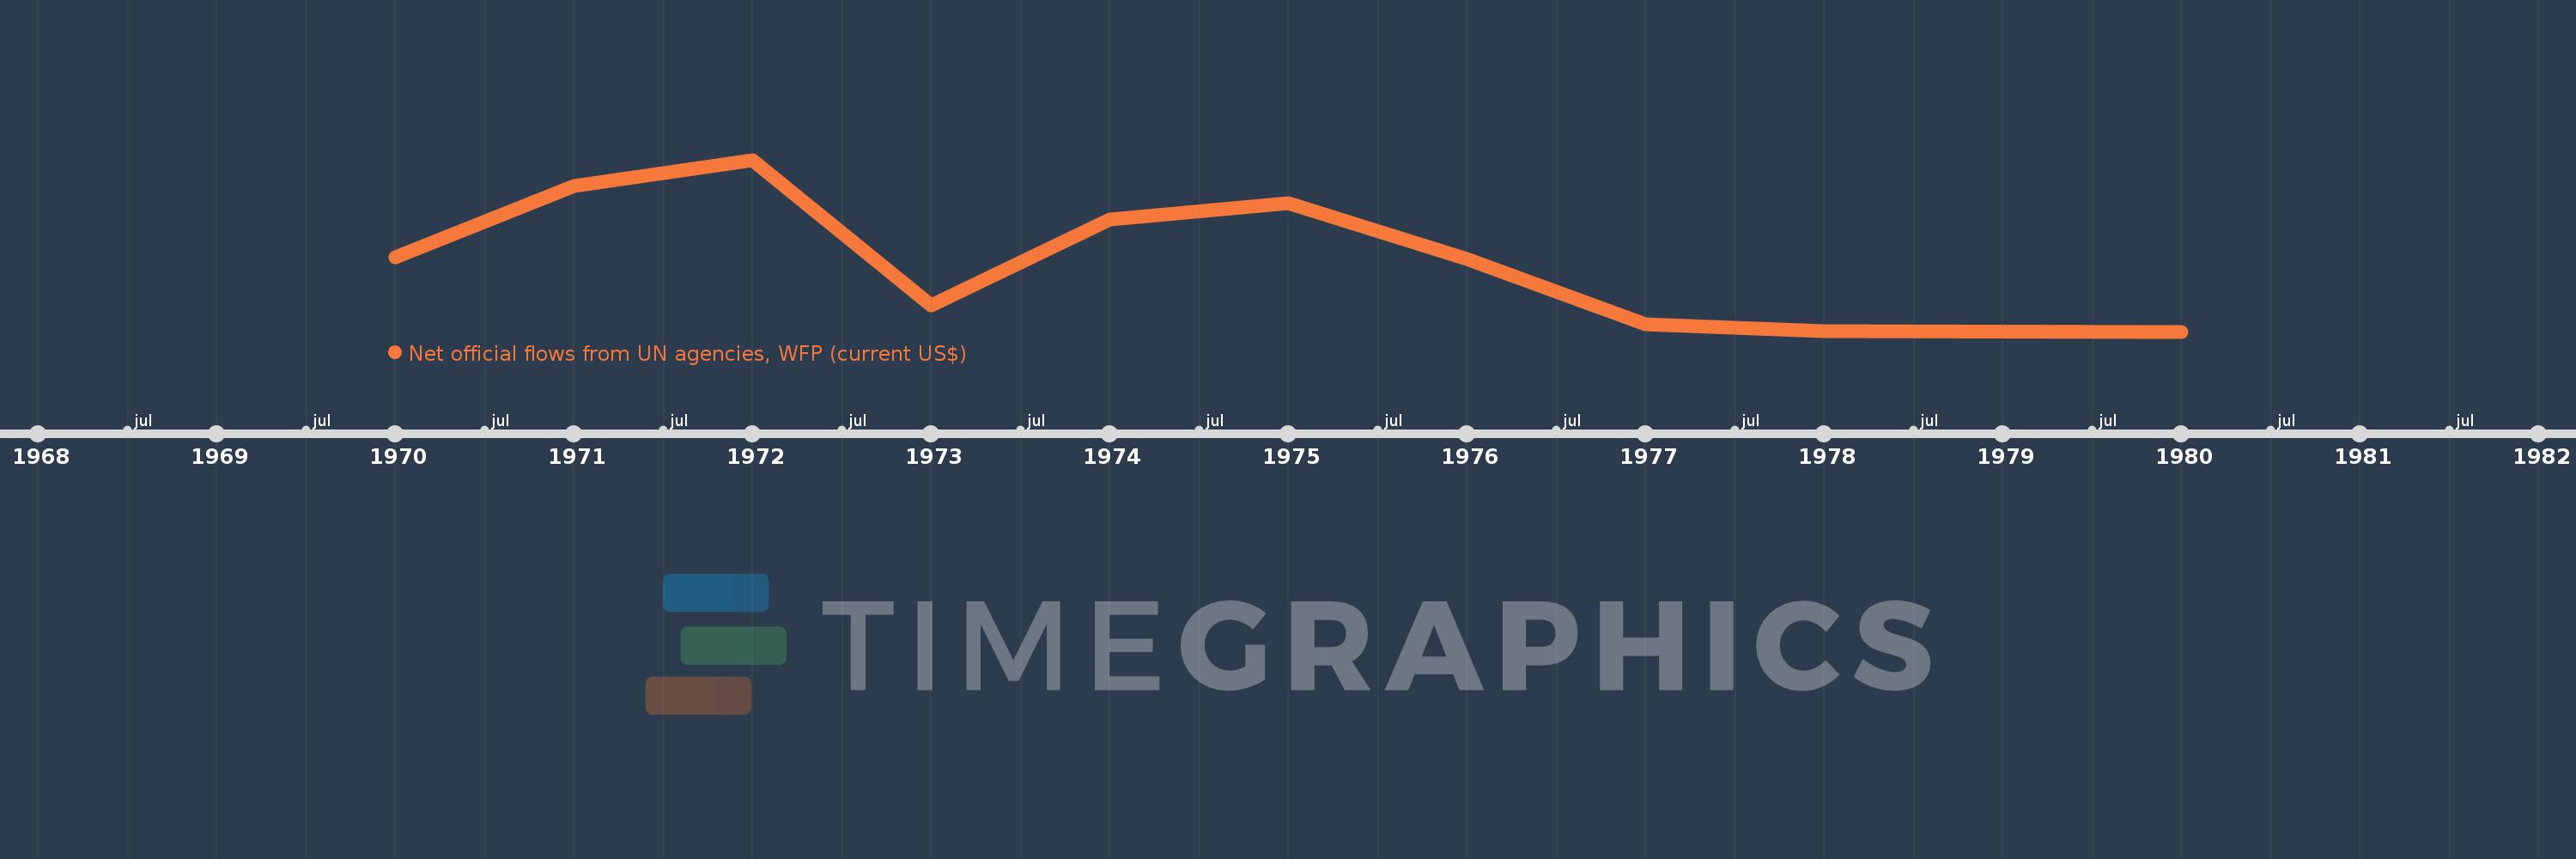
This timeline shows a graph from 1970 to 1980 of Nigeria. No data until 1969. Number of actual observations by date: 10.
Source name:
World Development Indicators
Source organization:
Development Assistance Committee of the Organisation for Economic Co-operation and Development, Geographical Distribution of Financial Flows to Developing Countries, Development Co-operation Report, and International Development Statistics database. Data are available online at: www.oecd.org/dac/stats/idsonline.
Categories, topics:
Aid Effectiveness
Last updated:
apr 23, 2017
Indicators value changes by year
Meaning:
2.741 mln
Minimum:
40.0K
jan 1, 1980
Maximum:
6.32 mln
jan 1, 1972
At the date of observation
Value
Absolute change
Change from the previous value
jan 1, 1970
2.75 mln
+2.75 mln
0.0%
jan 1, 1971
5.36 mln
+2.61 mln
94.91%
jan 1, 1972
6.32 mln
+960.0K
17.91%
jan 1, 1973
1.01 mln
-5.31 mln
-84.02%
jan 1, 1974
4.15 mln
+3.14 mln
310.89%
jan 1, 1975
4.72 mln
+570.0K
13.73%
jan 1, 1976
2.69 mln
-2.03 mln
-43.01%
jan 1, 1977
310.0K
-2.38 mln
-88.48%
jan 1, 1978
60.0K
-250.0K
-80.65%
jan 1, 1980
40.0K
-20.0K
-33.33%
Ranking of countries by current statistics by years