29
/
en
AIzaSyAYiBZKx7MnpbEhh9jyipgxe19OcubqV5w
April 1, 2024
259984
Tajikistan
TJK
true
2
1
Net official flows from UN agencies, WFP (current US$)
2015,2014,2013,2012,2011,2010,2009,2008,2007,2006,2005,2004,2003,2002,2001,2000,1999,1998,1997,1996,1995,1994
Download
Global statistics library →Tajikistan →

Net official flows from UN agencies, WFP (current US$)

This statistics in other country:
AfghanistanAlbaniaAlgeriaAngolaAntigua and BarbudaArab WorldArgentinaArmeniaAzerbaijanBangladeshBarbadosBelizeBeninBhutanBoliviaBosnia and HerzegovinaBotswanaBrazilBulgariaBurkina FasoBurundiCabo VerdeCambodiaCameroonCaribbean small statesCentral African RepublicCentral Europe and the BalticsChadChileChinaColombiaComorosCongo, Dem. Rep.Congo, Rep.Costa RicaCote d'IvoireCubaCyprusDjiboutiDominicaDominican RepublicEast Asia & PacificEast Asia & Pacific (excluding high income)East Asia & Pacific (IDA & IBRD countries)EcuadorEgypt, Arab Rep.El SalvadorEquatorial GuineaEritreaEstoniaEthiopiaEuro areaEurope & Central AsiaEurope & Central Asia (excluding high income)Europe & Central Asia (IDA & IBRD countries)European UnionFijiFragile and conflict affected situationsGabonGambia, TheGeorgiaGhanaGrenadaGuatemalaGuineaGuinea-BissauGuyanaHaitiHeavily indebted poor countries (HIPC)High incomeHondurasIBRD onlyIDA & IBRD totalIDA blendIDA onlyIDA totalIndiaIndonesiaIran, Islamic Rep.IraqJamaicaJordanKenyaKorea, Dem. People’s Rep.Korea, Rep.KuwaitKyrgyz RepublicLao PDRLatin America & Caribbean Latin America & Caribbean (excluding high income)Latin America & the Caribbean (IDA & IBRD countries)Least developed countries: UN classificationLebanonLesothoLiberiaLibyaLow & middle incomeLow incomeLower middle incomeMacedonia, FYRMadagascarMalawiMalaysiaMaldivesMaliMaltaMauritaniaMauritiusMexicoMiddle East & North AfricaMiddle East & North Africa (excluding high income)Middle East & North Africa (IDA & IBRD countries)Middle incomeMoldovaMongoliaMoroccoMozambiqueMyanmarNamibiaNepalNicaraguaNigerNigeriaOECD membersOmanOther small statesPacific island small statesPakistanPanamaPapua New GuineaParaguayPeruPhilippinesPolandRomaniaRussian FederationRwandaSamoaSao Tome and PrincipeSenegalSerbiaSeychellesSierra LeoneSingaporeSmall statesSolomon IslandsSomaliaSouth AfricaSouth AsiaSouth Asia (IDA & IBRD)South SudanSri LankaSt. Kitts and NevisSt. LuciaSt. Vincent and the GrenadinesSub-Saharan Africa Sub-Saharan Africa (excluding high income)Sub-Saharan Africa (IDA & IBRD countries)SudanSurinameSwazilandSyrian Arab RepublicTajikistanTanzaniaThailandTimor-LesteTogoTongaTrinidad and TobagoTunisiaTurkeyTurkmenistanUgandaUnited Arab EmiratesUpper middle incomeUruguayVanuatuVenezuela, RBVietnamWest Bank and GazaWorldYemen, Rep.ZambiaZimbabwe
Timeline:
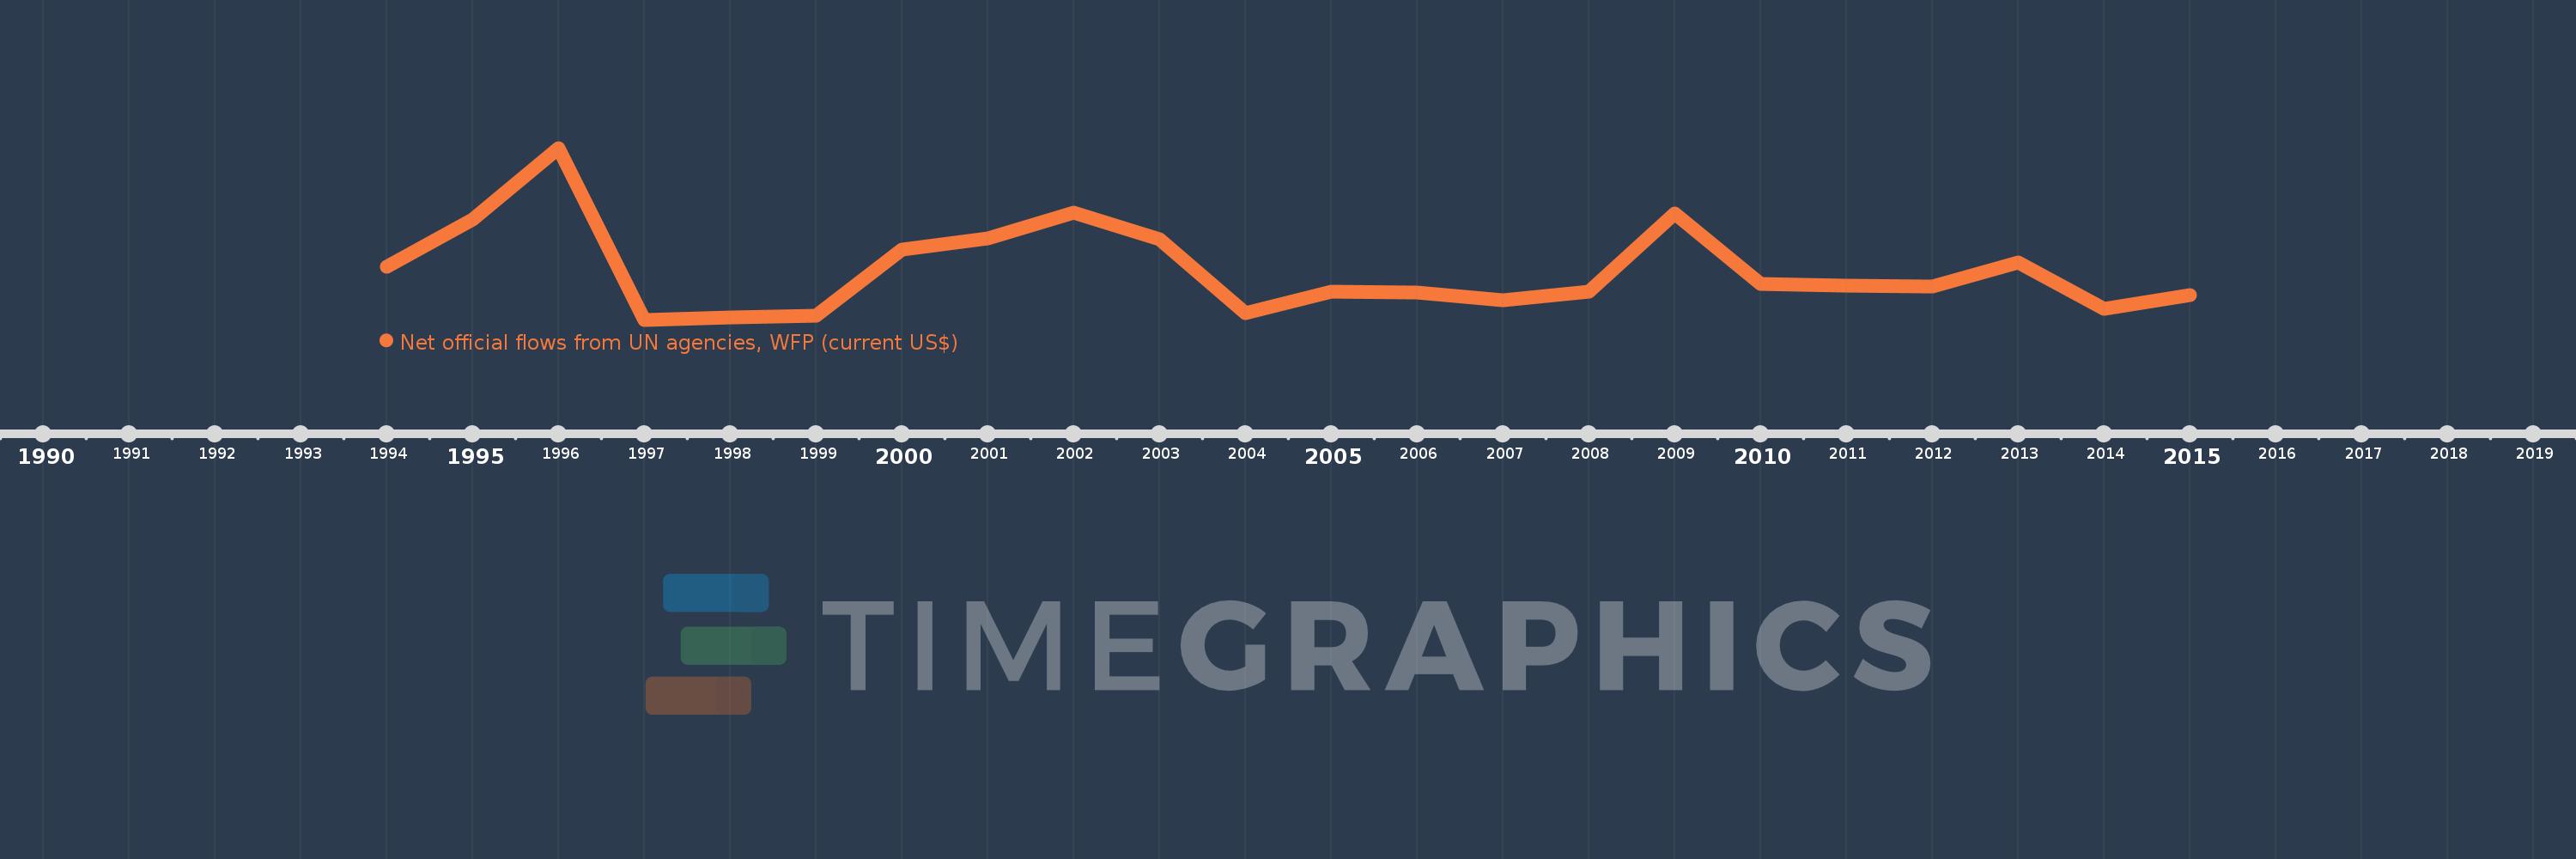
This timeline shows a graph from 1994 to 2015 of Tajikistan. No data until 1993. Number of actual observations by date: 22.
Source name:
World Development Indicators
Source organization:
Development Assistance Committee of the Organisation for Economic Co-operation and Development, Geographical Distribution of Financial Flows to Developing Countries, Development Co-operation Report, and International Development Statistics database. Data are available online at: www.oecd.org/dac/stats/idsonline.
Categories, topics:
Aid Effectiveness
Last updated:
apr 23, 2017
Indicators value changes by year
Mean:
2.983 mln
Minimum:
40.0K
jan 1, 1997
Maximum:
10.33 mln
jan 1, 1996
At the date of observation
Value
Absolute change
Change from previous value
jan 1, 1994
3.23 mln
+3.23 mln
0.0%
jan 1, 1995
6.05 mln
+2.82 mln
87.31%
jan 1, 1996
10.33 mln
+4.28 mln
70.74%
jan 1, 1997
40.0K
-10.29 mln
-99.61%
jan 1, 1998
160.0K
+120.0K
300.0%
jan 1, 1999
260.0K
+100.0K
62.5%
jan 1, 2000
4.25 mln
+3.99 mln
1.53K%
jan 1, 2001
4.9 mln
+650.0K
15.29%
jan 1, 2002
6.44 mln
+1.54 mln
31.43%
jan 1, 2003
4.86 mln
-1.58 mln
-24.53%
jan 1, 2004
420.0K
-4.44 mln
-91.36%
jan 1, 2005
1.72 mln
+1.3 mln
309.52%
jan 1, 2006
1.66 mln
-60.0K
-3.49%
jan 1, 2007
1.19 mln
-470.0K
-28.31%
jan 1, 2008
1.71 mln
+520.0K
43.7%
jan 1, 2009
6.38 mln
+4.67 mln
273.1%
jan 1, 2010
2.21 mln
-4.17 mln
-65.36%
jan 1, 2011
2.1 mln
-110.0K
-4.98%
jan 1, 2012
2.03 mln
-70.0K
-3.33%
jan 1, 2013
3.45 mln
+1.42 mln
69.95%
jan 1, 2014
710.0K
-2.74 mln
-79.42%
jan 1, 2015
1.52 mln
+810.0K
114.08%
Ranking of countries by current statistics by years

Comments:

Send
PremiumAbout & FeedbackTermsPrivacy
logo
© 2022 Selected Technologies LLC – Morgan Hill, California