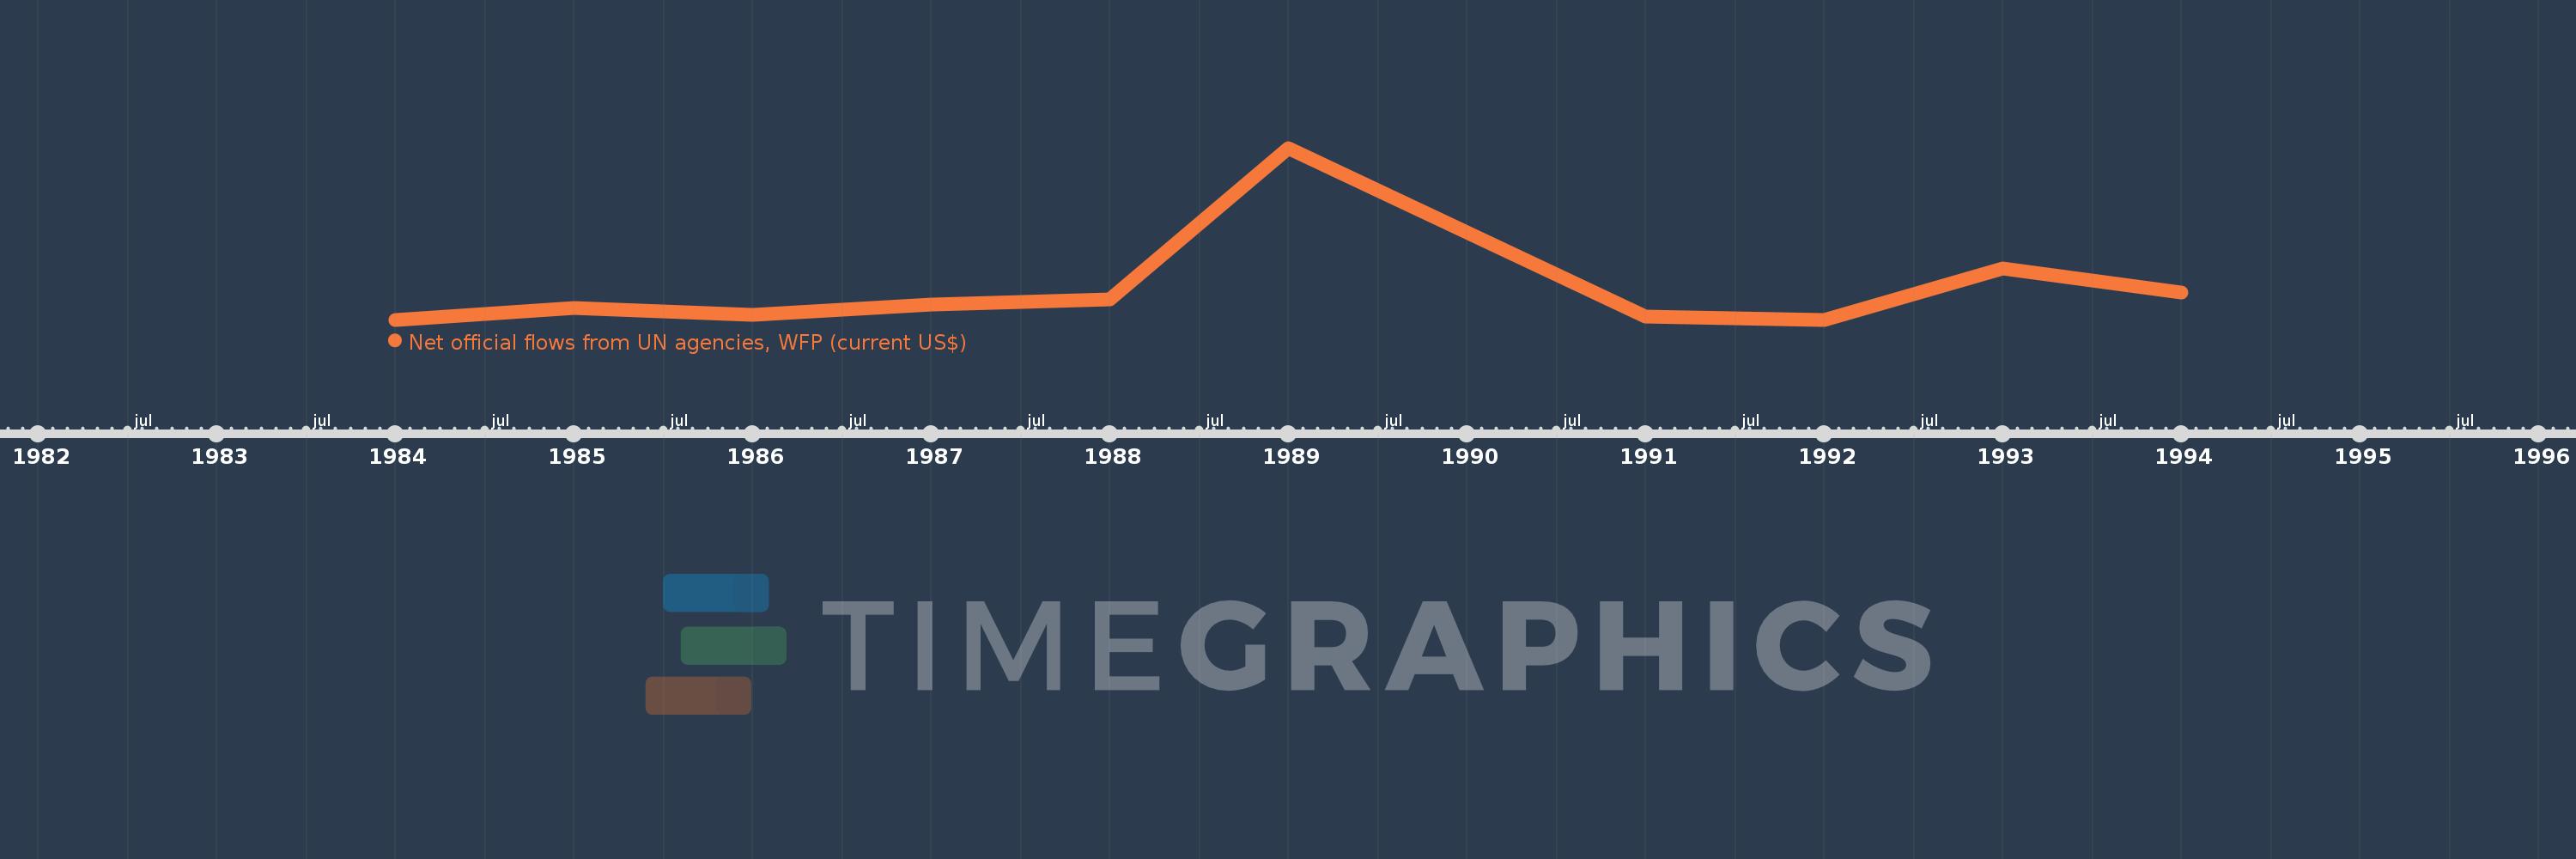
This timeline shows a graph from 1984 to 1994 of St. Vincent and the Grenadines. No data until 1983. Number of actual observations by date: 10.
Source name:
World Development Indicators
Source organization:
Development Assistance Committee of the Organisation for Economic Co-operation and Development, Geographical Distribution of Financial Flows to Developing Countries, Development Co-operation Report, and International Development Statistics database. Data are available online at: www.oecd.org/dac/stats/idsonline.
Categories, topics:
Aid Effectiveness
Last updated:
apr 23, 2017
Indicators value changes by year
Meaning:
340.0K
Minimum:
30.0K
jan 1, 1984
Maximum:
1.77 mln
jan 1, 1989
At the date of observation
Value
Absolute change
Change from the previous value
jan 1, 1984
30.0K
+30.0K
0.0%
jan 1, 1985
150.0K
+120.0K
400.0%
jan 1, 1986
80.0K
-70.0K
-46.67%
jan 1, 1987
180.0K
+100.0K
125.0%
jan 1, 1988
240.0K
+60.0K
33.33%
jan 1, 1989
1.77 mln
+1.53 mln
637.5%
jan 1, 1991
60.0K
-1.71 mln
-96.61%
jan 1, 1992
30.0K
-30.0K
-50.0%
jan 1, 1993
550.0K
+520.0K
1.73K%
jan 1, 1994
310.0K
-240.0K
-43.64%
Ranking of countries by current statistics by years