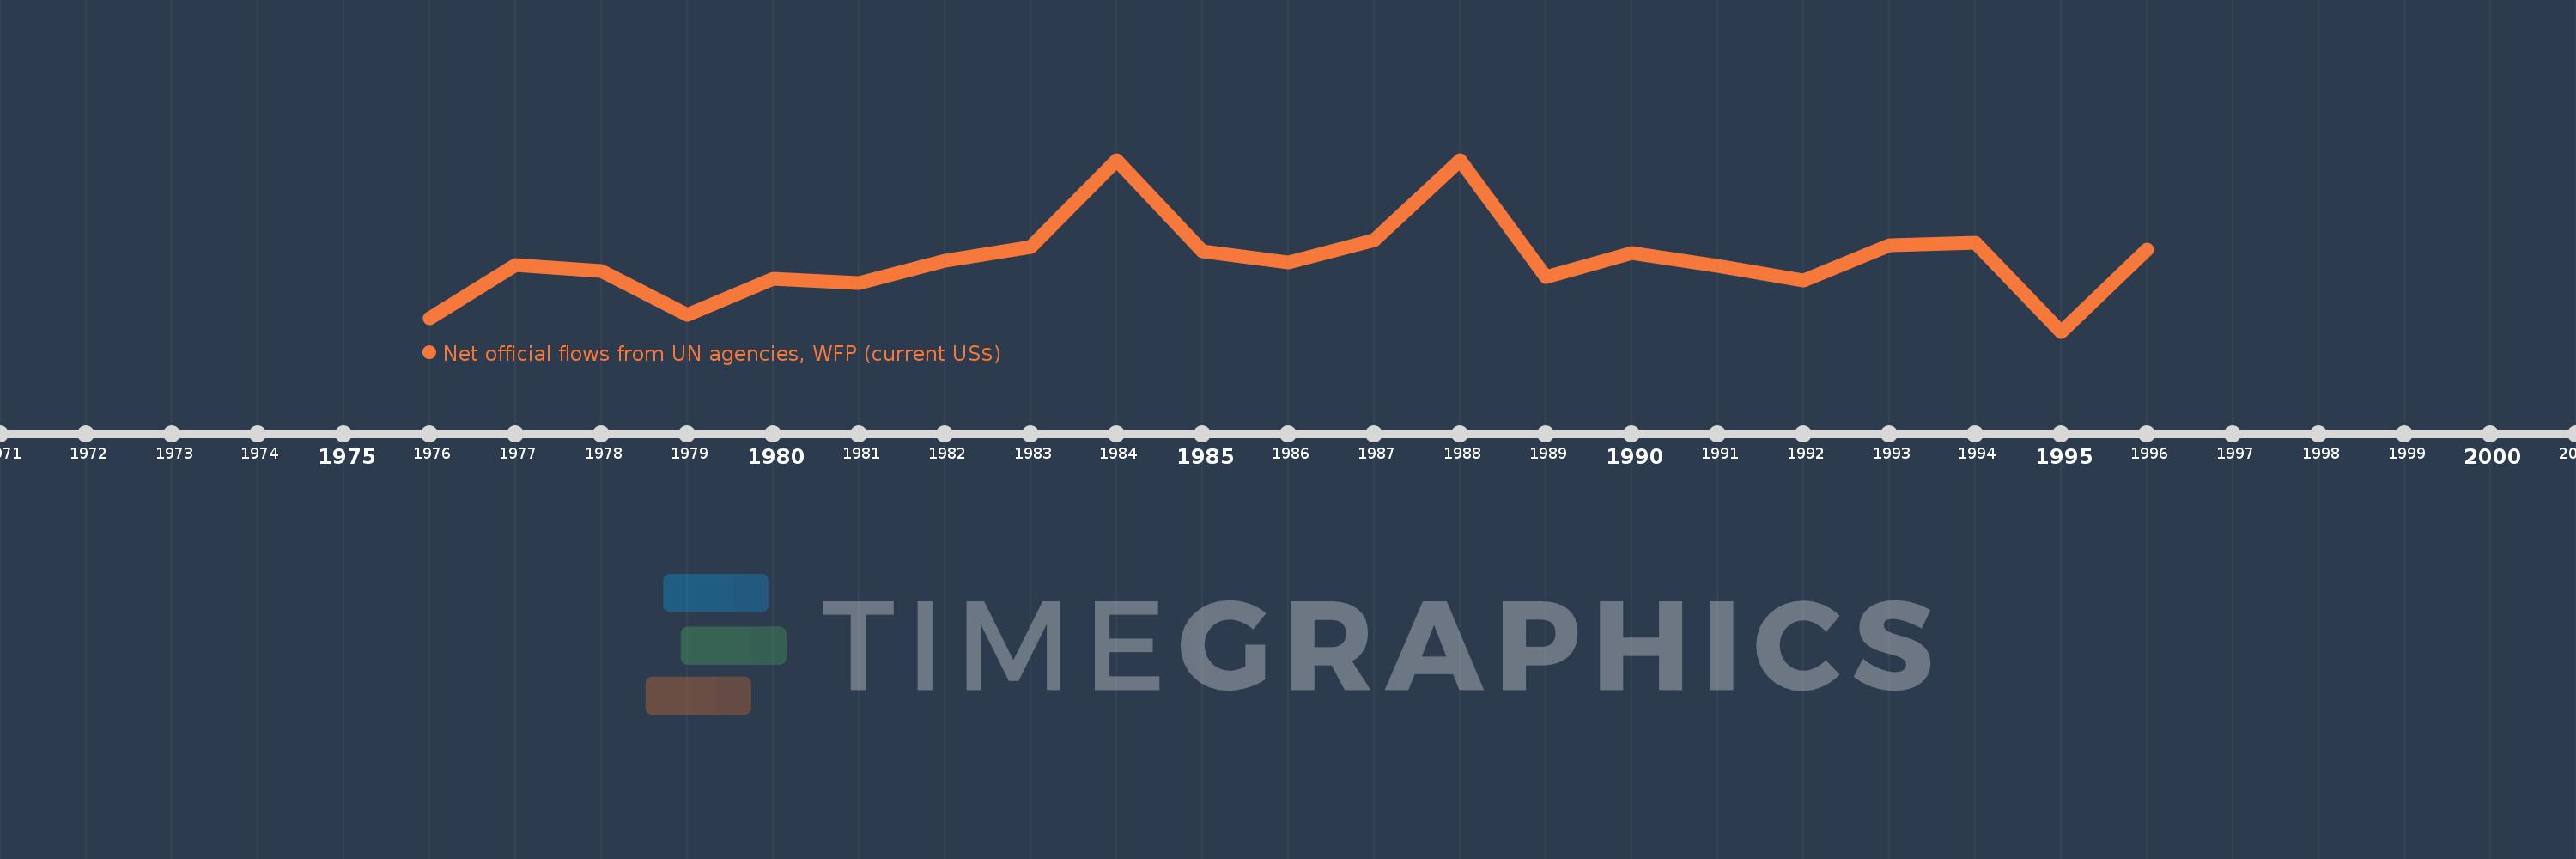
This timeline shows a graph from 1976 to 1996 of Comoros. No data until 1975. Number of actual observations by date: 21.
Source name:
World Development Indicators
Source organization:
Development Assistance Committee of the Organisation for Economic Co-operation and Development, Geographical Distribution of Financial Flows to Developing Countries, Development Co-operation Report, and International Development Statistics database. Data are available online at: www.oecd.org/dac/stats/idsonline.
Categories, topics:
Aid Effectiveness
Last updated:
apr 23, 2017
Indicators value changes by year
Meaning:
1.322 mln
Minimum:
-30.0K
jan 1, 1995
Maximum:
3.21 mln
jan 1, 1988
At the date of observation
Value
Absolute change
Change from the previous value
jan 1, 1976
220.0K
+220.0K
0.0%
jan 1, 1977
1.22 mln
+1000.0K
454.55%
jan 1, 1978
1.12 mln
-100.0K
-8.2%
jan 1, 1979
290.0K
-830.0K
-74.11%
jan 1, 1980
970.0K
+680.0K
234.48%
jan 1, 1981
880.0K
-90.0K
-9.28%
jan 1, 1982
1.3 mln
+420.0K
47.73%
jan 1, 1983
1.57 mln
+270.0K
20.77%
jan 1, 1984
3.2 mln
+1.63 mln
103.82%
jan 1, 1985
1.48 mln
-1.72 mln
-53.75%
jan 1, 1986
1.28 mln
-200.0K
-13.51%
jan 1, 1987
1.69 mln
+410.0K
32.03%
jan 1, 1988
3.21 mln
+1.52 mln
89.94%
jan 1, 1989
1000.0K
-2.21 mln
-68.85%
jan 1, 1990
1.46 mln
+460.0K
46.0%
jan 1, 1991
1.21 mln
-250.0K
-17.12%
jan 1, 1992
940.0K
-270.0K
-22.31%
jan 1, 1993
1.6 mln
+660.0K
70.21%
jan 1, 1994
1.65 mln
+50.0K
3.13%
jan 1, 1995
-30.0K
-1.68 mln
-101.82%
jan 1, 1996
1.51 mln
+1.54 mln
-5.13K%
Ranking of countries by current statistics by years