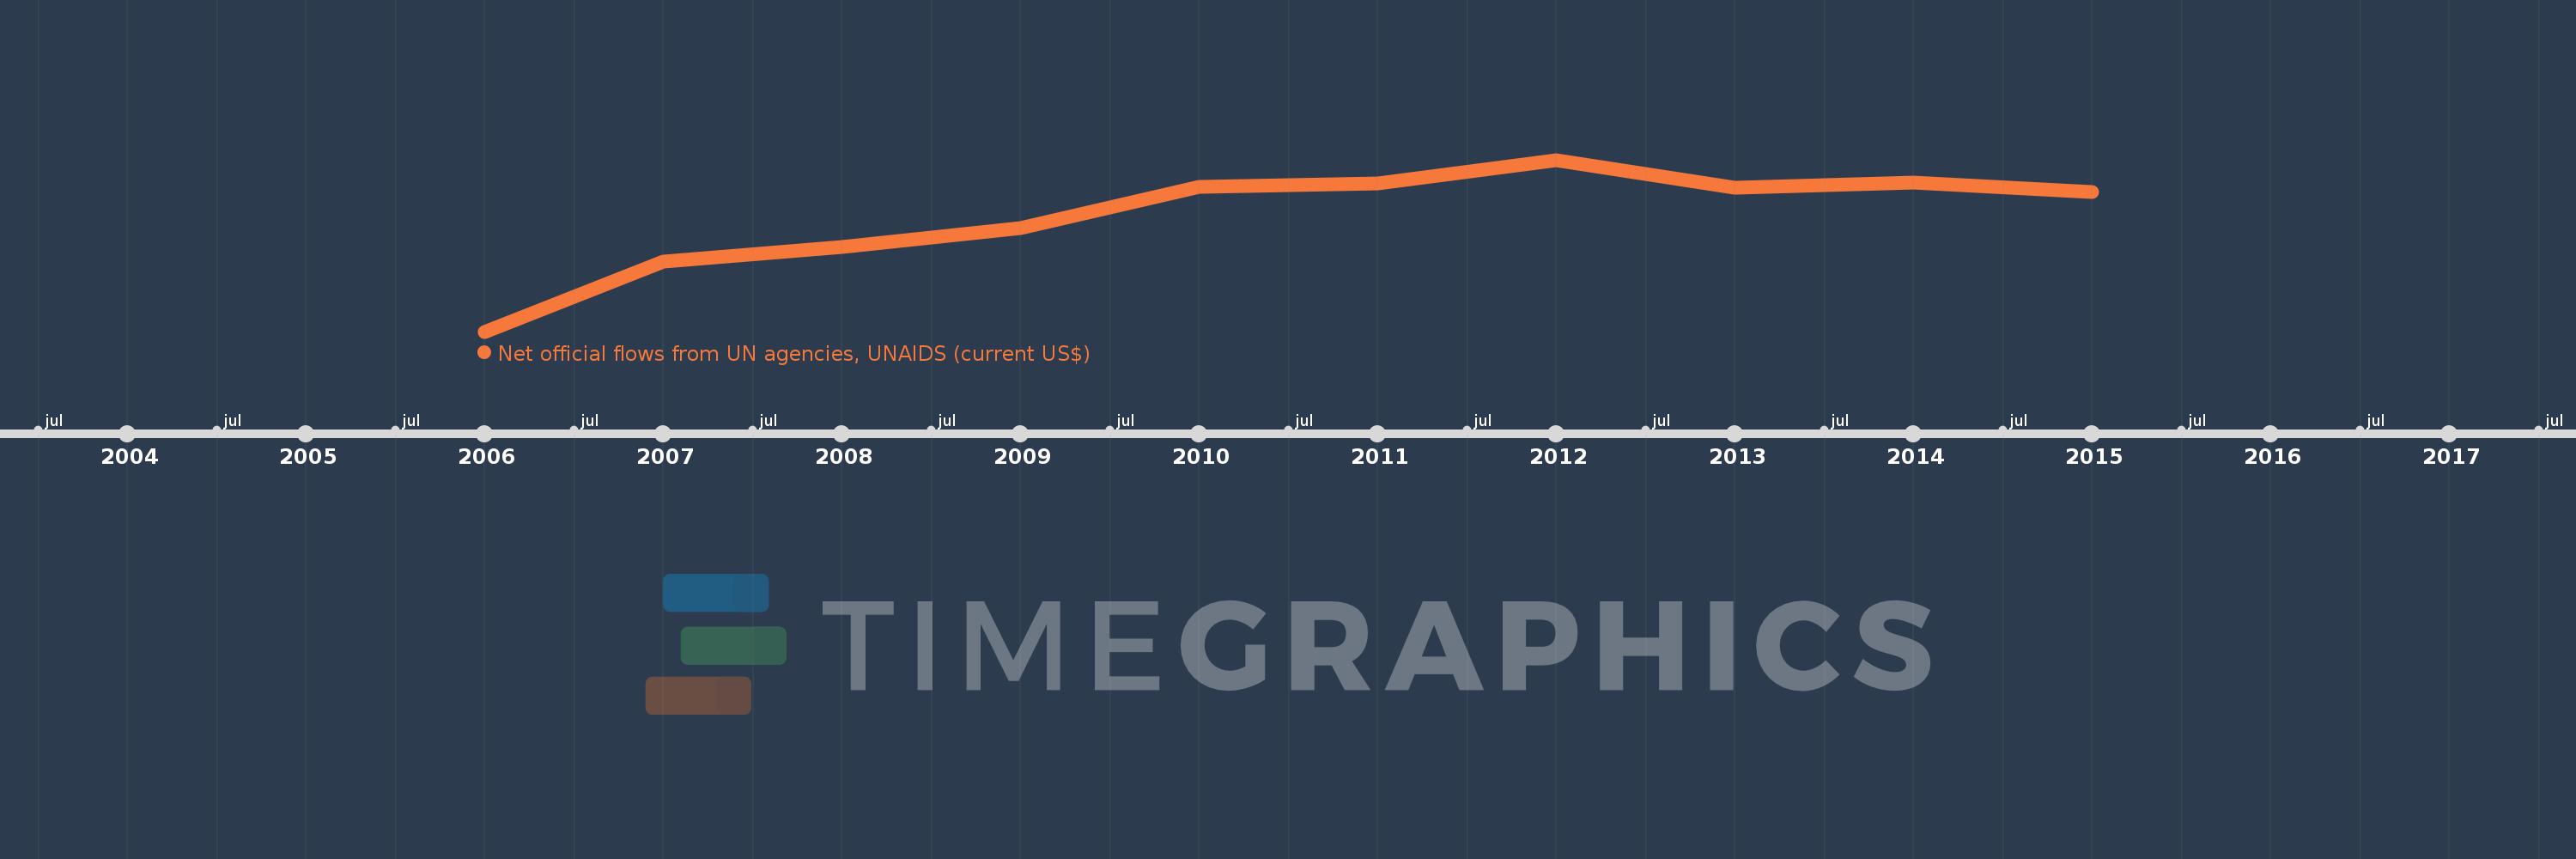
This timeline shows a graph from 2006 to 2015 of World. No data until 2005. Number of actual observations by date: 10.
Source name:
World Development Indicators
Source organization:
Development Assistance Committee of the Organisation for Economic Co-operation and Development, Geographical Distribution of Financial Flows to Developing Countries, Development Co-operation Report, and International Development Statistics database. Data are available online at: www.oecd.org/dac/stats/idsonline.
Categories, topics:
Aid Effectiveness
Last updated:
apr 23, 2017
Indicators value changes by year
Meaning:
218.697 mln
Minimum:
122.91 mln
jan 1, 2006
Maximum:
265.47 mln
jan 1, 2012
At the date of observation
Value
Absolute change
Change from the previous value
jan 1, 2006
122.91 mln
+122.91 mln
0.0%
jan 1, 2007
180.69 mln
+57.78 mln
47.01%
jan 1, 2008
193.1 mln
+12.41 mln
6.87%
jan 1, 2009
208.95 mln
+15.85 mln
8.21%
jan 1, 2010
243.03 mln
+34.08 mln
16.31%
jan 1, 2011
245.76 mln
+2.73 mln
1.12%
jan 1, 2012
265.47 mln
+19.71 mln
8.02%
jan 1, 2013
241.97 mln
-23.5 mln
-8.85%
jan 1, 2014
246.44 mln
+4.47 mln
1.85%
jan 1, 2015
238.65 mln
-7.79 mln
-3.16%
Ranking of countries by current statistics by years