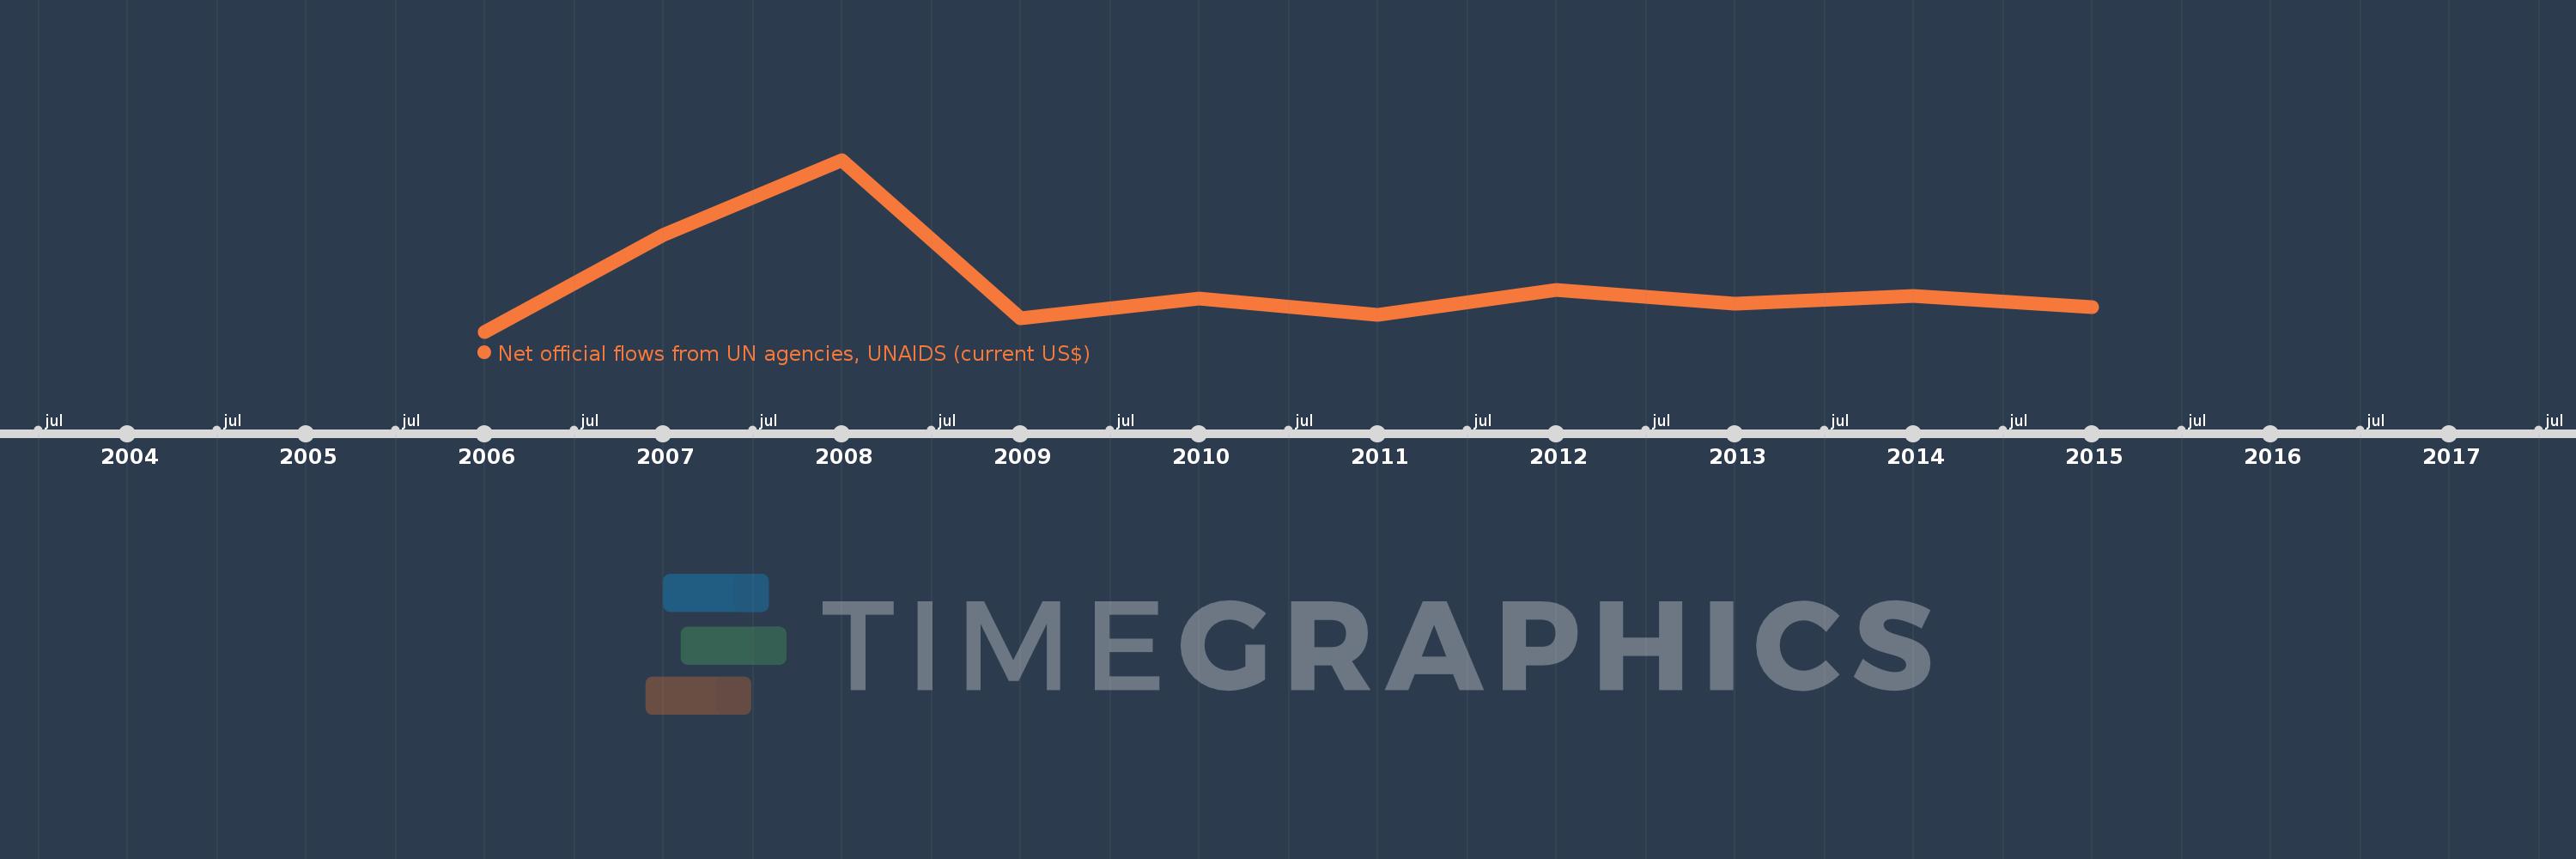
This timeline shows a graph from 2006 to 2015 of Thailand. No data until 2005. Number of actual observations by date: 10.
Source name:
World Development Indicators
Source organization:
Development Assistance Committee of the Organisation for Economic Co-operation and Development, Geographical Distribution of Financial Flows to Developing Countries, Development Co-operation Report, and International Development Statistics database. Data are available online at: www.oecd.org/dac/stats/idsonline.
Categories, topics:
Aid Effectiveness
Last updated:
apr 23, 2017
Indicators value changes by year
Meaning:
1.162 mln
Minimum:
460.0K
jan 1, 2006
Maximum:
3.08 mln
jan 1, 2008
At the date of observation
Value
Absolute change
Change from the previous value
jan 1, 2006
460.0K
+460.0K
0.0%
jan 1, 2007
1.93 mln
+1.47 mln
319.57%
jan 1, 2008
3.08 mln
+1.15 mln
59.59%
jan 1, 2009
660.0K
-2.42 mln
-78.57%
jan 1, 2010
970.0K
+310.0K
46.97%
jan 1, 2011
710.0K
-260.0K
-26.8%
jan 1, 2012
1.09 mln
+380.0K
53.52%
jan 1, 2013
890.0K
-200.0K
-18.35%
jan 1, 2014
1000.0K
+110.0K
12.36%
jan 1, 2015
830.0K
-170.0K
-17.0%
Ranking of countries by current statistics by years