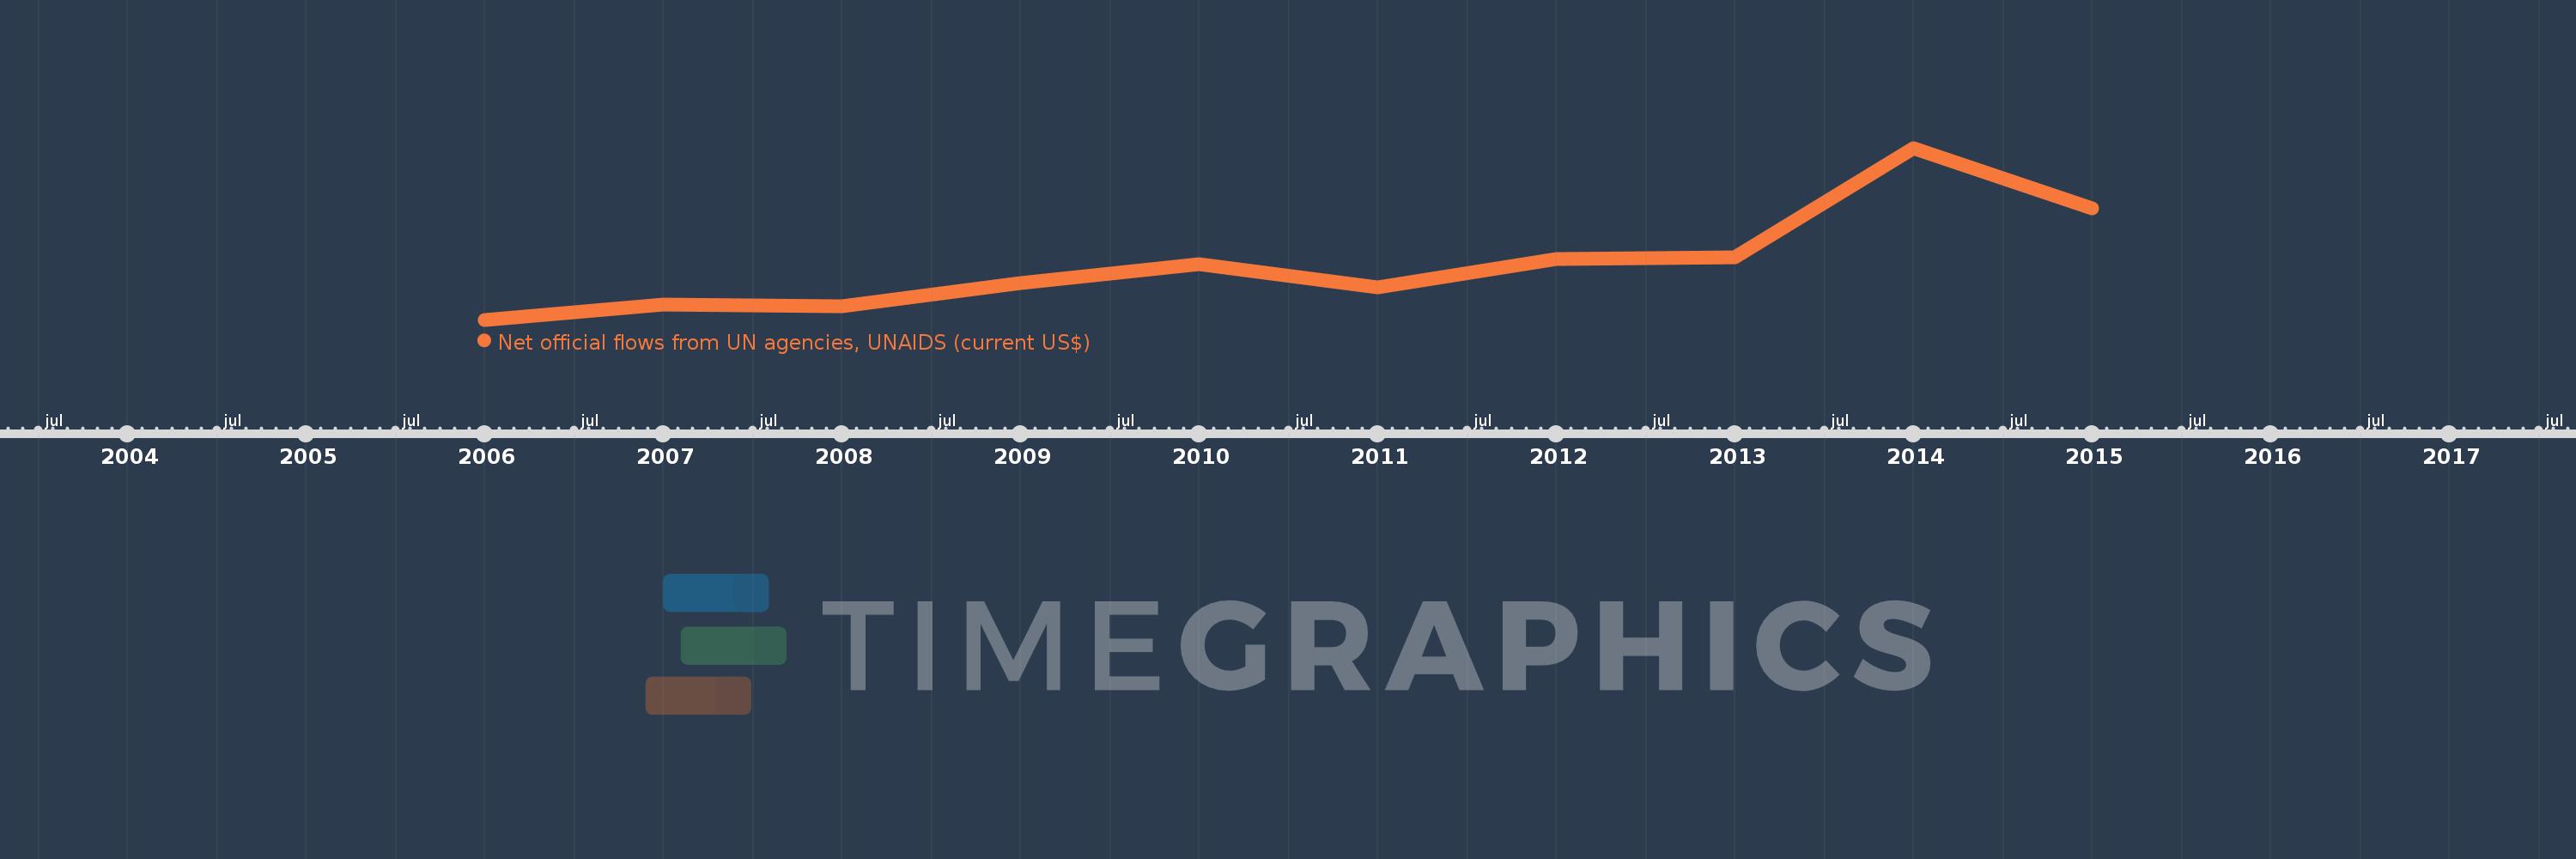
This timeline shows a graph from 2006 to 2015 of Cameroon. No data until 2005. Number of actual observations by date: 10.
Source name:
World Development Indicators
Source organization:
Development Assistance Committee of the Organisation for Economic Co-operation and Development, Geographical Distribution of Financial Flows to Developing Countries, Development Co-operation Report, and International Development Statistics database. Data are available online at: www.oecd.org/dac/stats/idsonline.
Categories, topics:
Aid Effectiveness
Last updated:
apr 23, 2017
Indicators value changes by year
Meaning:
682.0K
Minimum:
350.0K
jan 1, 2006
Maximum:
1.37 mln
jan 1, 2014
At the date of observation
Value
Absolute change
Change from the previous value
jan 1, 2006
350.0K
+350.0K
0.0%
jan 1, 2007
440.0K
+90.0K
25.71%
jan 1, 2008
430.0K
-10.0K
-2.27%
jan 1, 2009
570.0K
+140.0K
32.56%
jan 1, 2010
680.0K
+110.0K
19.3%
jan 1, 2011
540.0K
-140.0K
-20.59%
jan 1, 2012
710.0K
+170.0K
31.48%
jan 1, 2013
720.0K
+10.0K
1.41%
jan 1, 2014
1.37 mln
+650.0K
90.28%
jan 1, 2015
1.01 mln
-360.0K
-26.28%
Ranking of countries by current statistics by years