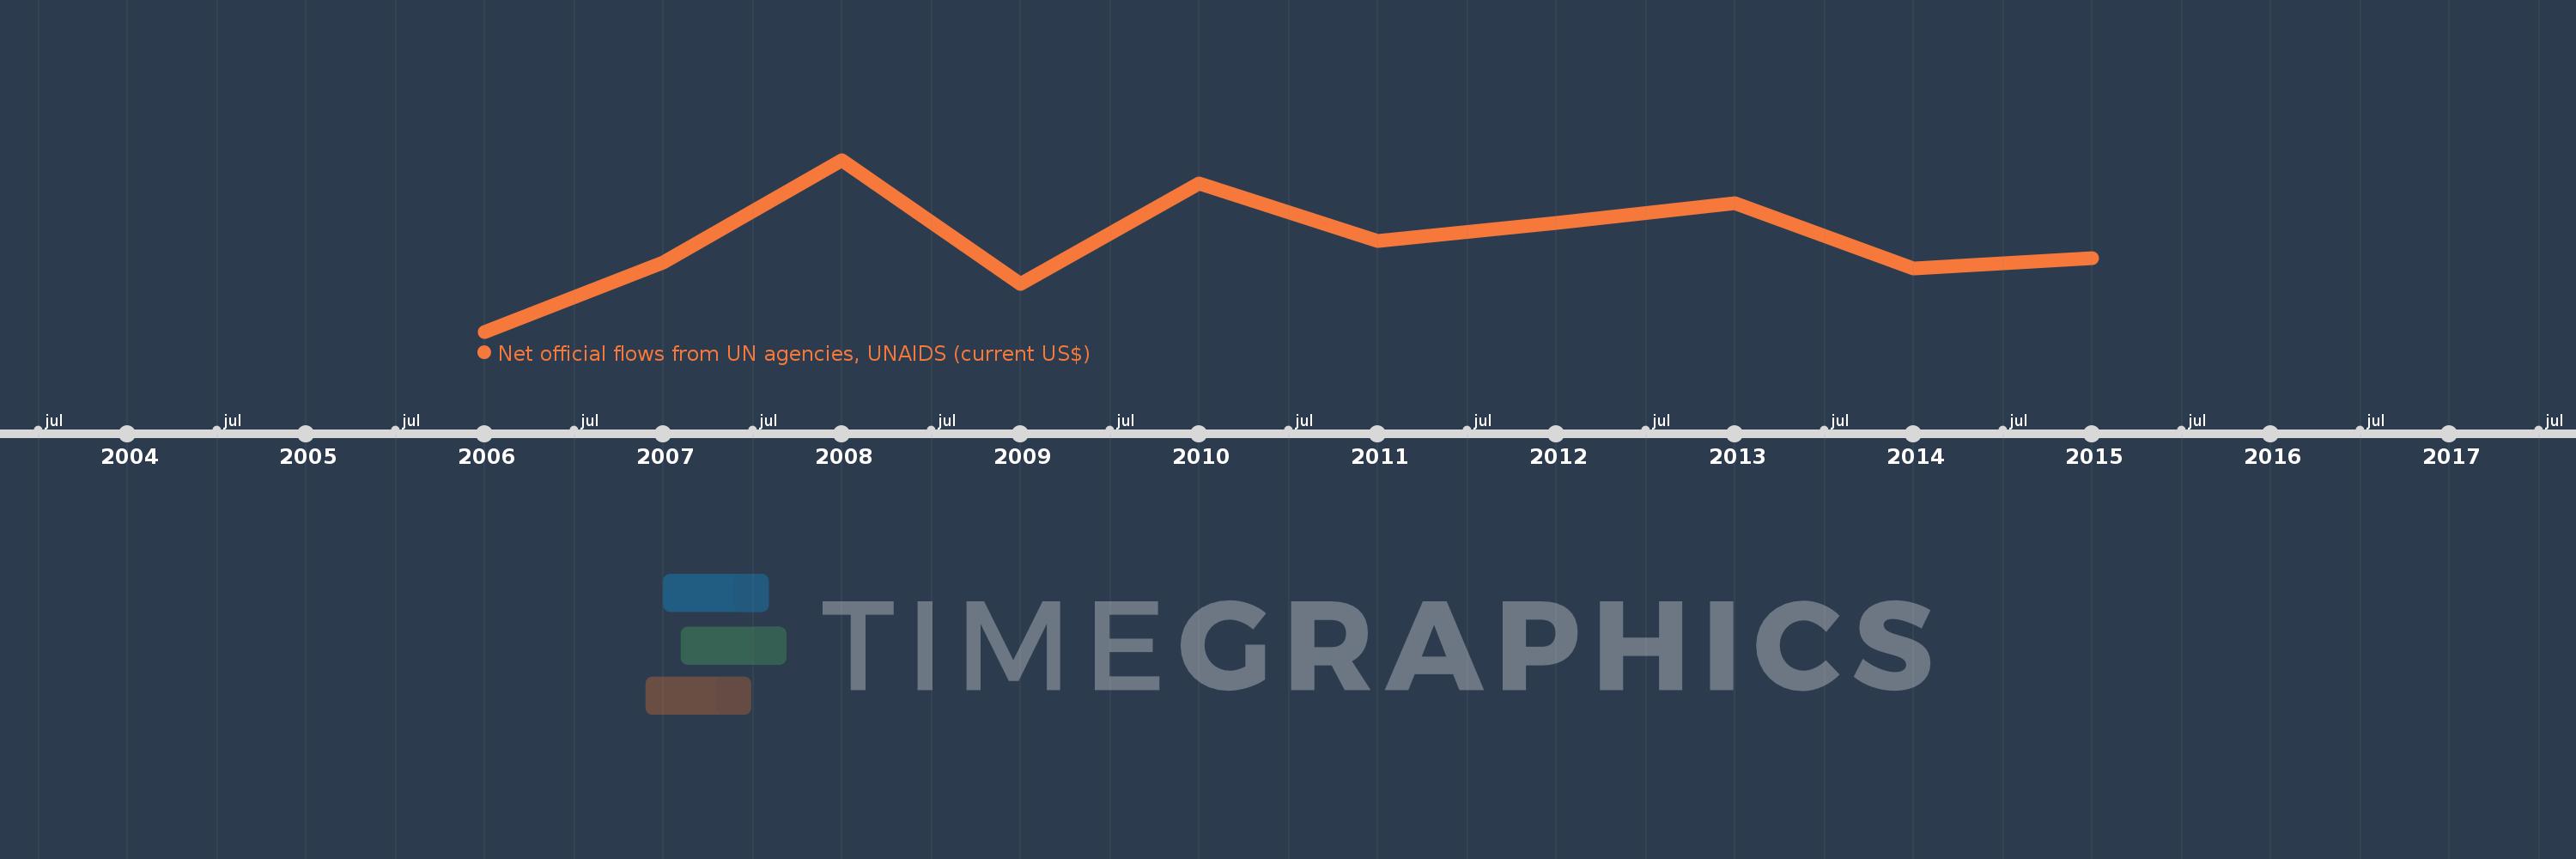
This timeline shows a graph from 2006 to 2015 of Pakistan. No data until 2005. Number of actual observations by date: 10.
Source name:
World Development Indicators
Source organization:
Development Assistance Committee of the Organisation for Economic Co-operation and Development, Geographical Distribution of Financial Flows to Developing Countries, Development Co-operation Report, and International Development Statistics database. Data are available online at: www.oecd.org/dac/stats/idsonline.
Categories, topics:
Aid Effectiveness
Last updated:
apr 23, 2017
Indicators value changes by year
Meaning:
716.0K
Minimum:
260.0K
jan 1, 2006
Maximum:
1.13 mln
jan 1, 2008
At the date of observation
Value
Absolute change
Change from the previous value
jan 1, 2006
260.0K
+260.0K
0.0%
jan 1, 2007
610.0K
+350.0K
134.62%
jan 1, 2008
1.13 mln
+520.0K
85.25%
jan 1, 2009
500.0K
-630.0K
-55.75%
jan 1, 2010
1.01 mln
+510.0K
102.0%
jan 1, 2011
720.0K
-290.0K
-28.71%
jan 1, 2012
810.0K
+90.0K
12.5%
jan 1, 2013
910.0K
+100.0K
12.35%
jan 1, 2014
580.0K
-330.0K
-36.26%
jan 1, 2015
630.0K
+50.0K
8.62%
Ranking of countries by current statistics by years