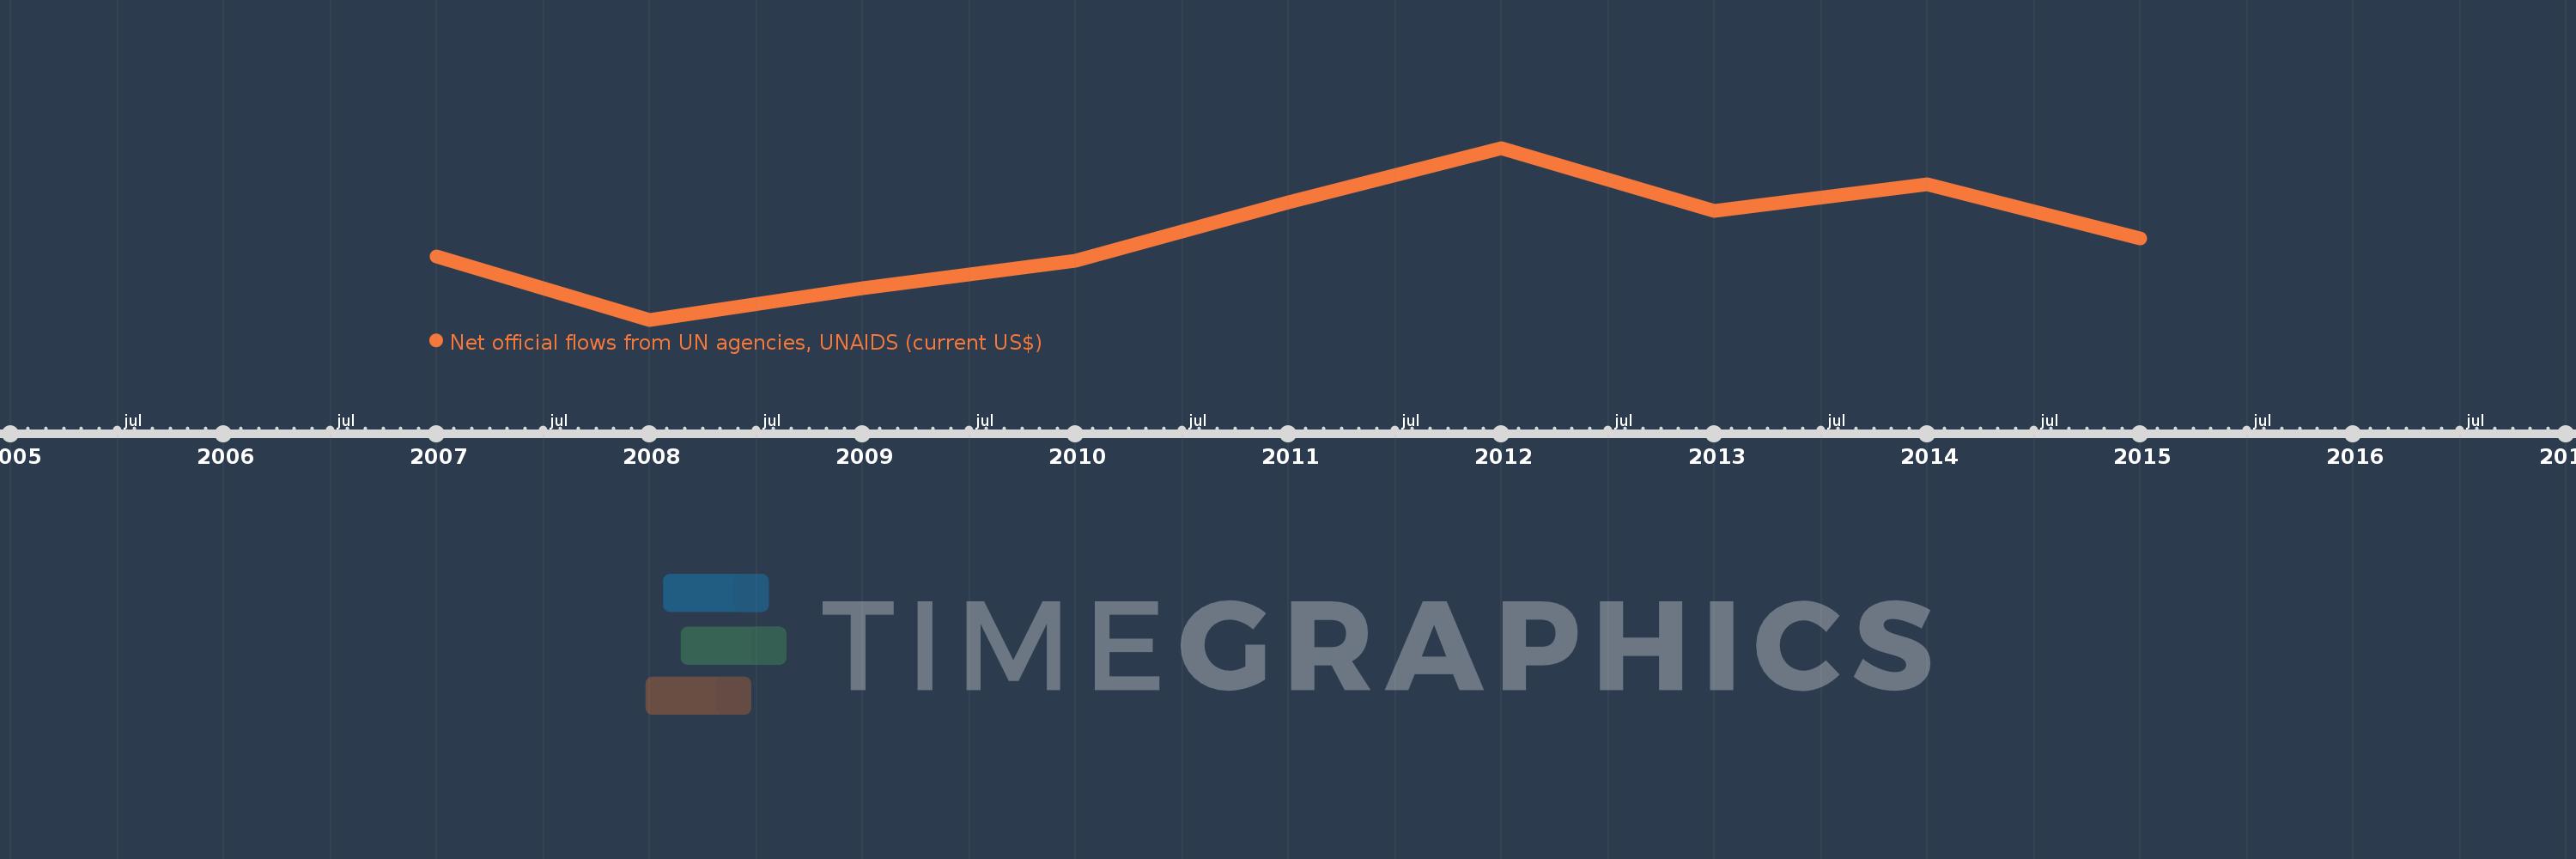
This timeline shows a graph from 2007 to 2015 of Niger. No data until 2006. Number of actual observations by date: 9.
Source name:
World Development Indicators
Source organization:
Development Assistance Committee of the Organisation for Economic Co-operation and Development, Geographical Distribution of Financial Flows to Developing Countries, Development Co-operation Report, and International Development Statistics database. Data are available online at: www.oecd.org/dac/stats/idsonline.
Categories, topics:
Aid Effectiveness
Last updated:
apr 23, 2017
Indicators value changes by year
Meaning:
378.889K
Minimum:
190.0K
jan 1, 2008
Maximum:
570.0K
jan 1, 2012
At the date of observation
Value
Absolute change
Change from the previous value
jan 1, 2007
330.0K
+330.0K
0.0%
jan 1, 2008
190.0K
-140.0K
-42.42%
jan 1, 2009
260.0K
+70.0K
36.84%
jan 1, 2010
320.0K
+60.0K
23.08%
jan 1, 2011
450.0K
+130.0K
40.63%
jan 1, 2012
570.0K
+120.0K
26.67%
jan 1, 2013
430.0K
-140.0K
-24.56%
jan 1, 2014
490.0K
+60.0K
13.95%
jan 1, 2015
370.0K
-120.0K
-24.49%
Ranking of countries by current statistics by years