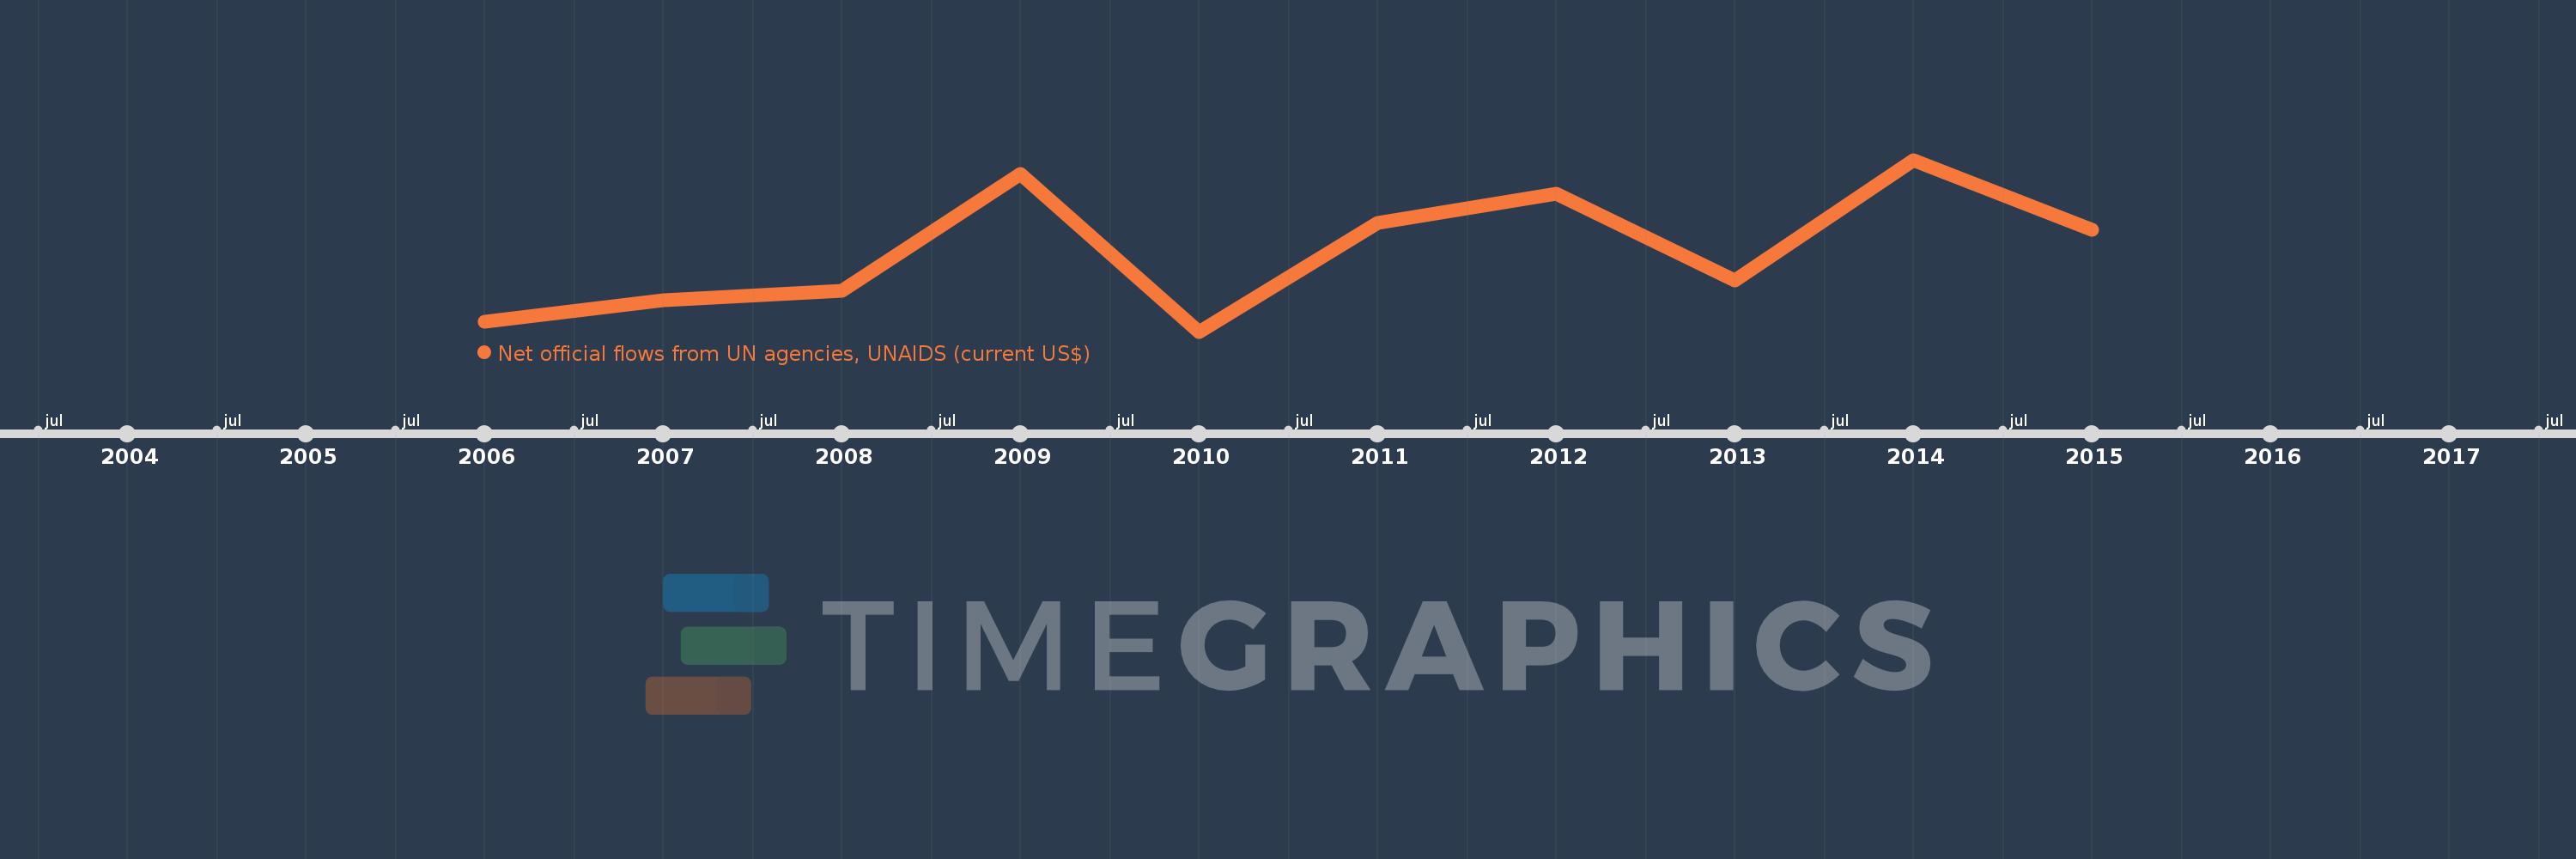
This timeline shows a graph from 2006 to 2015 of Indonesia. No data until 2005. Number of actual observations by date: 10.
Source name:
World Development Indicators
Source organization:
Development Assistance Committee of the Organisation for Economic Co-operation and Development, Geographical Distribution of Financial Flows to Developing Countries, Development Co-operation Report, and International Development Statistics database. Data are available online at: www.oecd.org/dac/stats/idsonline.
Categories, topics:
Aid Effectiveness
Last updated:
apr 23, 2017
Indicators value changes by year
Meaning:
855.0K
Minimum:
520.0K
jan 1, 2010
Maximum:
1.23 mln
jan 1, 2014
At the date of observation
Value
Absolute change
Change from the previous value
jan 1, 2006
560.0K
+560.0K
0.0%
jan 1, 2007
650.0K
+90.0K
16.07%
jan 1, 2008
690.0K
+40.0K
6.15%
jan 1, 2009
1.17 mln
+480.0K
69.57%
jan 1, 2010
520.0K
-650.0K
-55.56%
jan 1, 2011
970.0K
+450.0K
86.54%
jan 1, 2012
1.09 mln
+120.0K
12.37%
jan 1, 2013
730.0K
-360.0K
-33.03%
jan 1, 2014
1.23 mln
+500.0K
68.49%
jan 1, 2015
940.0K
-290.0K
-23.58%
Ranking of countries by current statistics by years