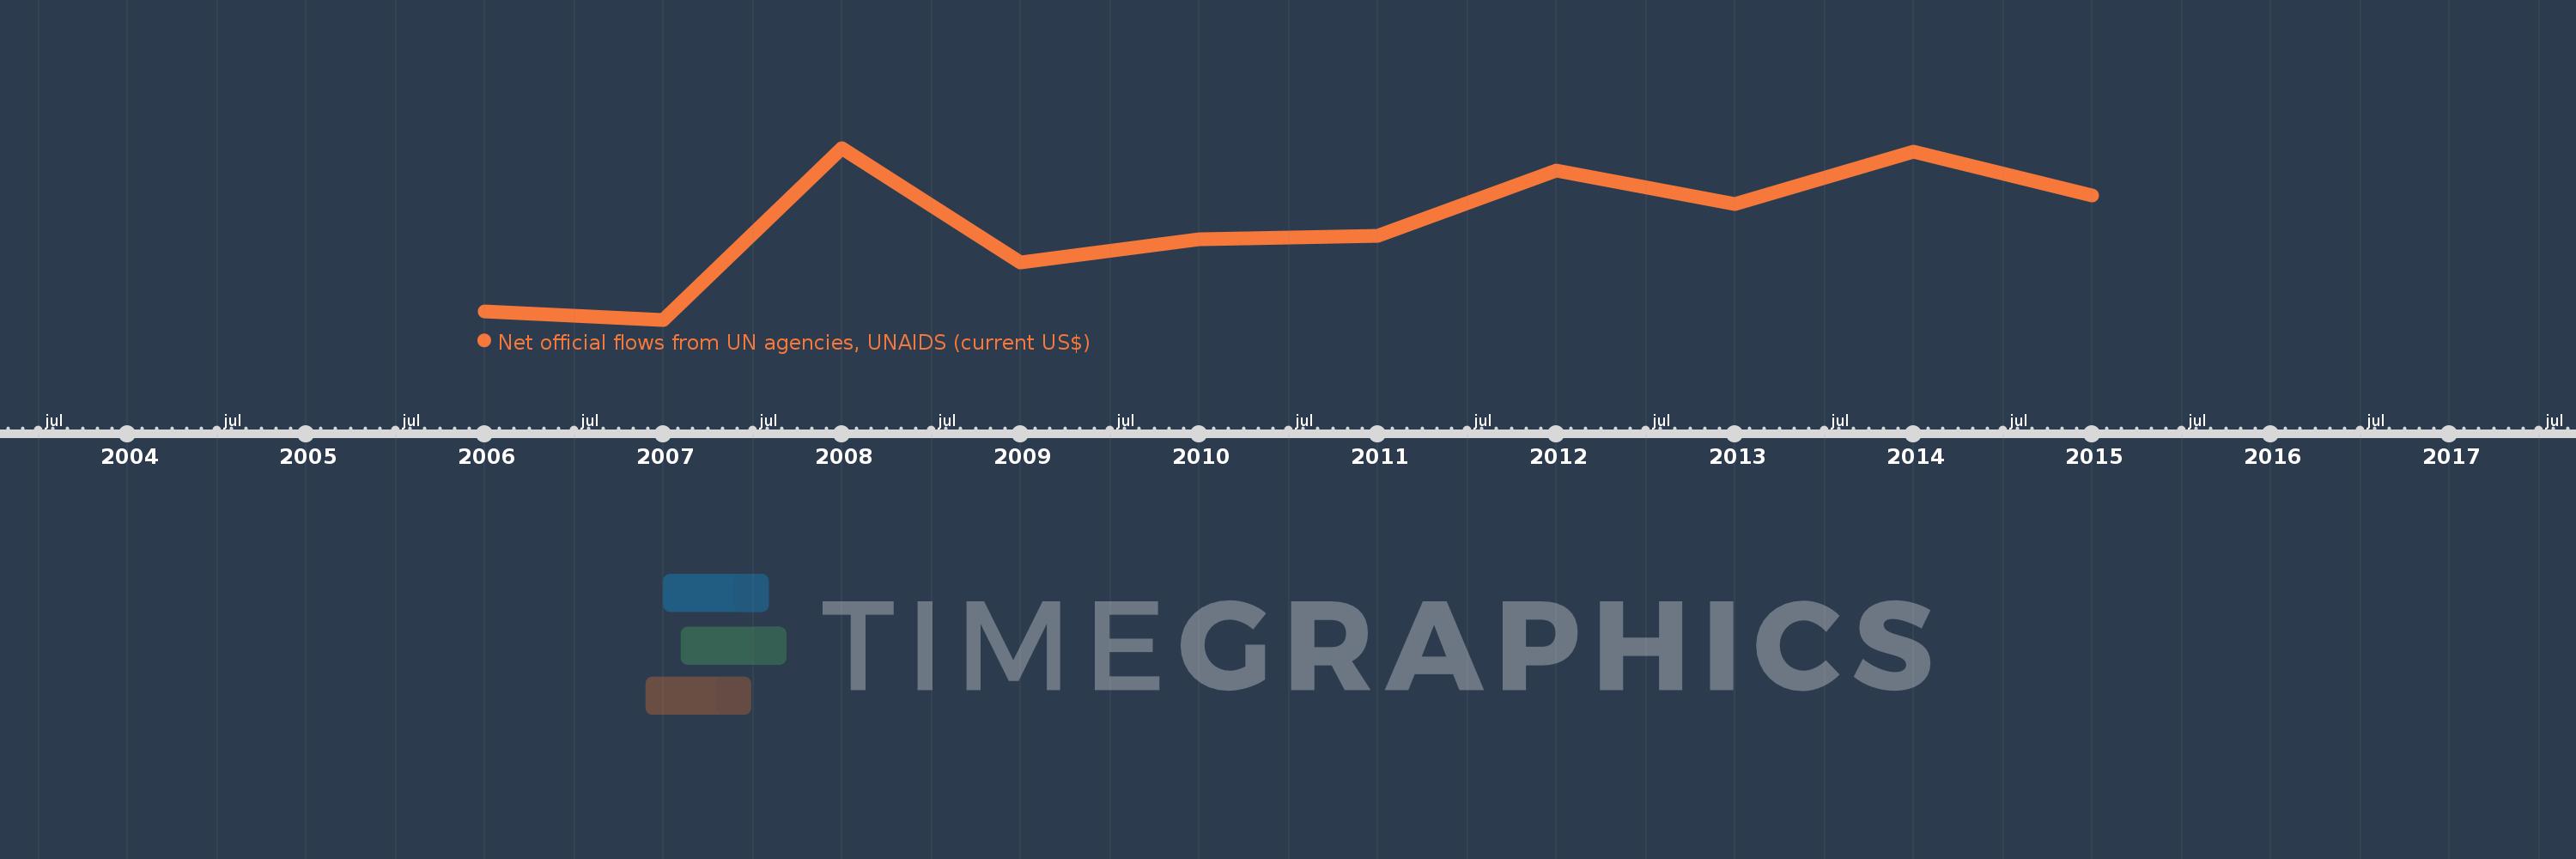
This timeline shows a graph from 2006 to 2015 of Least developed countries: UN classification. No data until 2005. Number of actual observations by date: 10.
Source name:
World Development Indicators
Source organization:
Development Assistance Committee of the Organisation for Economic Co-operation and Development, Geographical Distribution of Financial Flows to Developing Countries, Development Co-operation Report, and International Development Statistics database. Data are available online at: www.oecd.org/dac/stats/idsonline.
Categories, topics:
Aid Effectiveness
Last updated:
apr 23, 2017
Indicators value changes by year
Meaning:
21.89 mln
Minimum:
12.4 mln
jan 1, 2007
Maximum:
29.39 mln
jan 1, 2008
At the date of observation
Value
Absolute change
Change from the previous value
jan 1, 2006
13.23 mln
+13.23 mln
0.0%
jan 1, 2007
12.4 mln
-830.0K
-6.27%
jan 1, 2008
29.39 mln
+16.99 mln
137.02%
jan 1, 2009
18.08 mln
-11.31 mln
-38.48%
jan 1, 2010
20.38 mln
+2.3 mln
12.72%
jan 1, 2011
20.69 mln
+310.0K
1.52%
jan 1, 2012
27.18 mln
+6.49 mln
31.37%
jan 1, 2013
23.87 mln
-3.31 mln
-12.18%
jan 1, 2014
29.01 mln
+5.14 mln
21.53%
jan 1, 2015
24.67 mln
-4.34 mln
-14.96%
Ranking of countries by current statistics by years