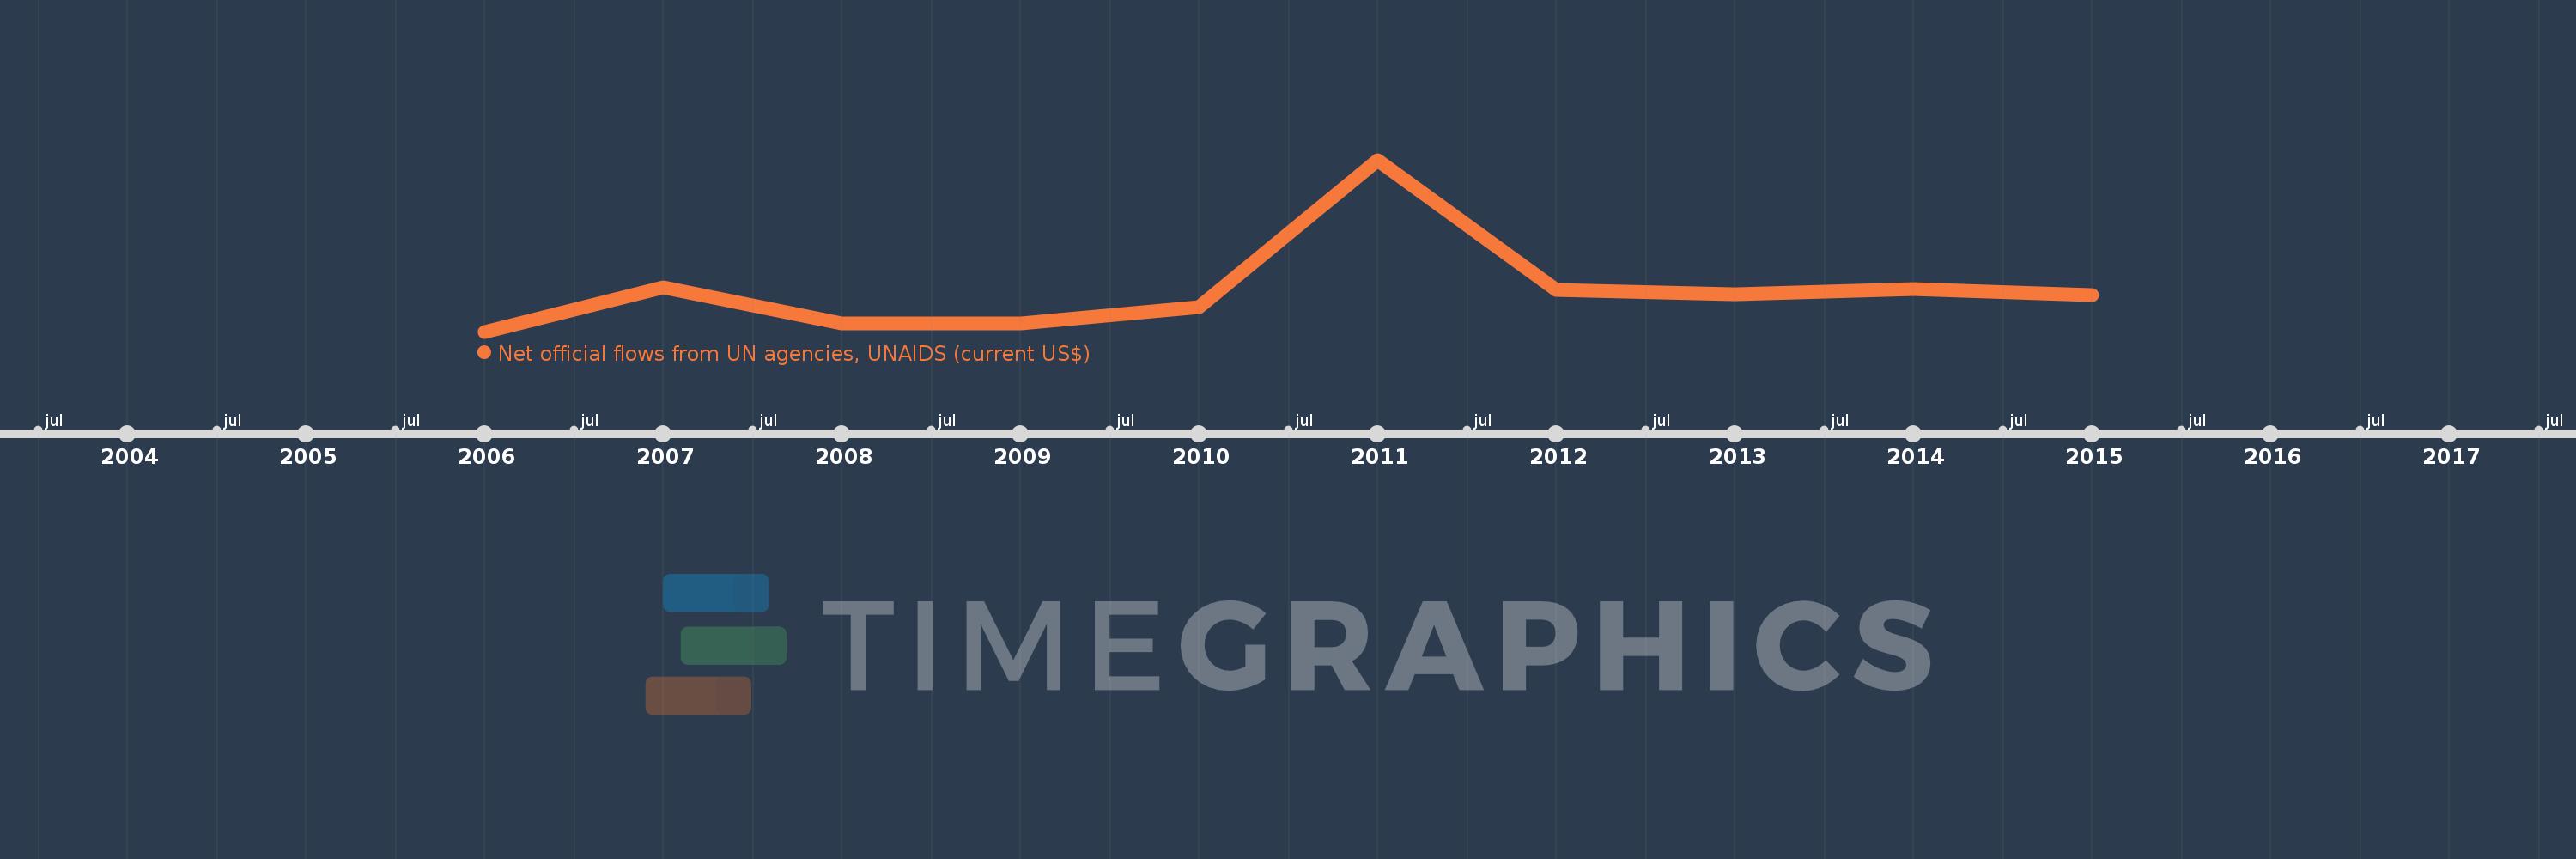
This timeline shows a graph from 2006 to 2015 of Congo, Rep.. No data until 2005. Number of actual observations by date: 10.
Source name:
World Development Indicators
Source organization:
Development Assistance Committee of the Organisation for Economic Co-operation and Development, Geographical Distribution of Financial Flows to Developing Countries, Development Co-operation Report, and International Development Statistics database. Data are available online at: www.oecd.org/dac/stats/idsonline.
Categories, topics:
Aid Effectiveness
Last updated:
apr 23, 2017
Indicators value changes by year
Meaning:
719.0K
Minimum:
400.0K
jan 1, 2006
Maximum:
1.72 mln
jan 1, 2011
At the date of observation
Value
Absolute change
Change from the previous value
jan 1, 2006
400.0K
+400.0K
0.0%
jan 1, 2007
740.0K
+340.0K
85.0%
jan 1, 2008
460.0K
-280.0K
-37.84%
jan 1, 2009
460.0K
0.0
0.0%
jan 1, 2010
590.0K
+130.0K
28.26%
jan 1, 2011
1.72 mln
+1.13 mln
191.53%
jan 1, 2012
720.0K
-1000.0K
-58.14%
jan 1, 2013
690.0K
-30.0K
-4.17%
jan 1, 2014
730.0K
+40.0K
5.8%
jan 1, 2015
680.0K
-50.0K
-6.85%
Ranking of countries by current statistics by years