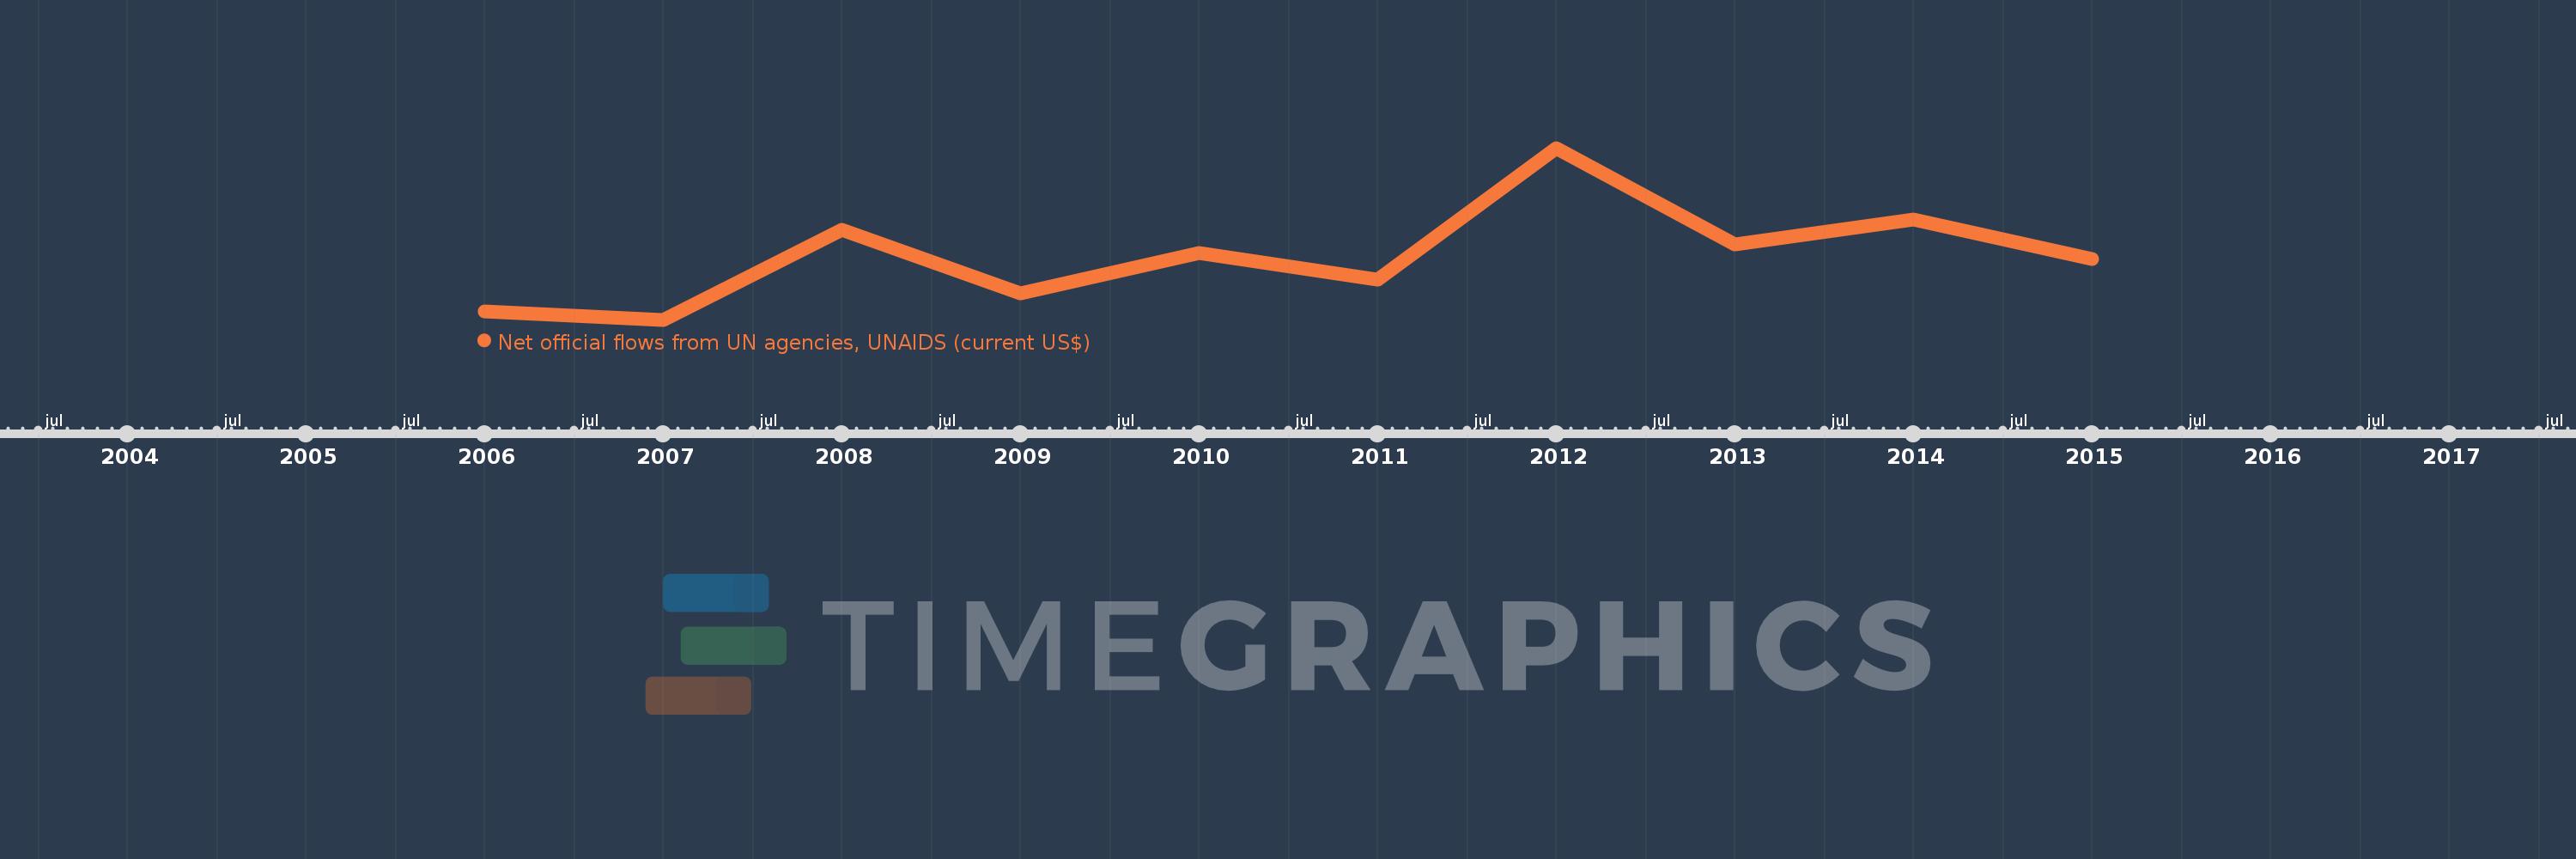
This timeline shows a graph from 2006 to 2015 of Namibia. No data until 2005. Number of actual observations by date: 10.
Source name:
World Development Indicators
Source organization:
Development Assistance Committee of the Organisation for Economic Co-operation and Development, Geographical Distribution of Financial Flows to Developing Countries, Development Co-operation Report, and International Development Statistics database. Data are available online at: www.oecd.org/dac/stats/idsonline.
Categories, topics:
Aid Effectiveness
Last updated:
apr 23, 2017
Indicators value changes by year
Meaning:
748.0K
Minimum:
220.0K
jan 1, 2007
Maximum:
1.64 mln
jan 1, 2012
At the date of observation
Value
Absolute change
Change from the previous value
jan 1, 2006
290.0K
+290.0K
0.0%
jan 1, 2007
220.0K
-70.0K
-24.14%
jan 1, 2008
960.0K
+740.0K
336.36%
jan 1, 2009
440.0K
-520.0K
-54.17%
jan 1, 2010
770.0K
+330.0K
75.0%
jan 1, 2011
550.0K
-220.0K
-28.57%
jan 1, 2012
1.64 mln
+1.09 mln
198.18%
jan 1, 2013
840.0K
-800.0K
-48.78%
jan 1, 2014
1.05 mln
+210.0K
25.0%
jan 1, 2015
720.0K
-330.0K
-31.43%
Ranking of countries by current statistics by years