Download This statistics in other country:
Timeline:
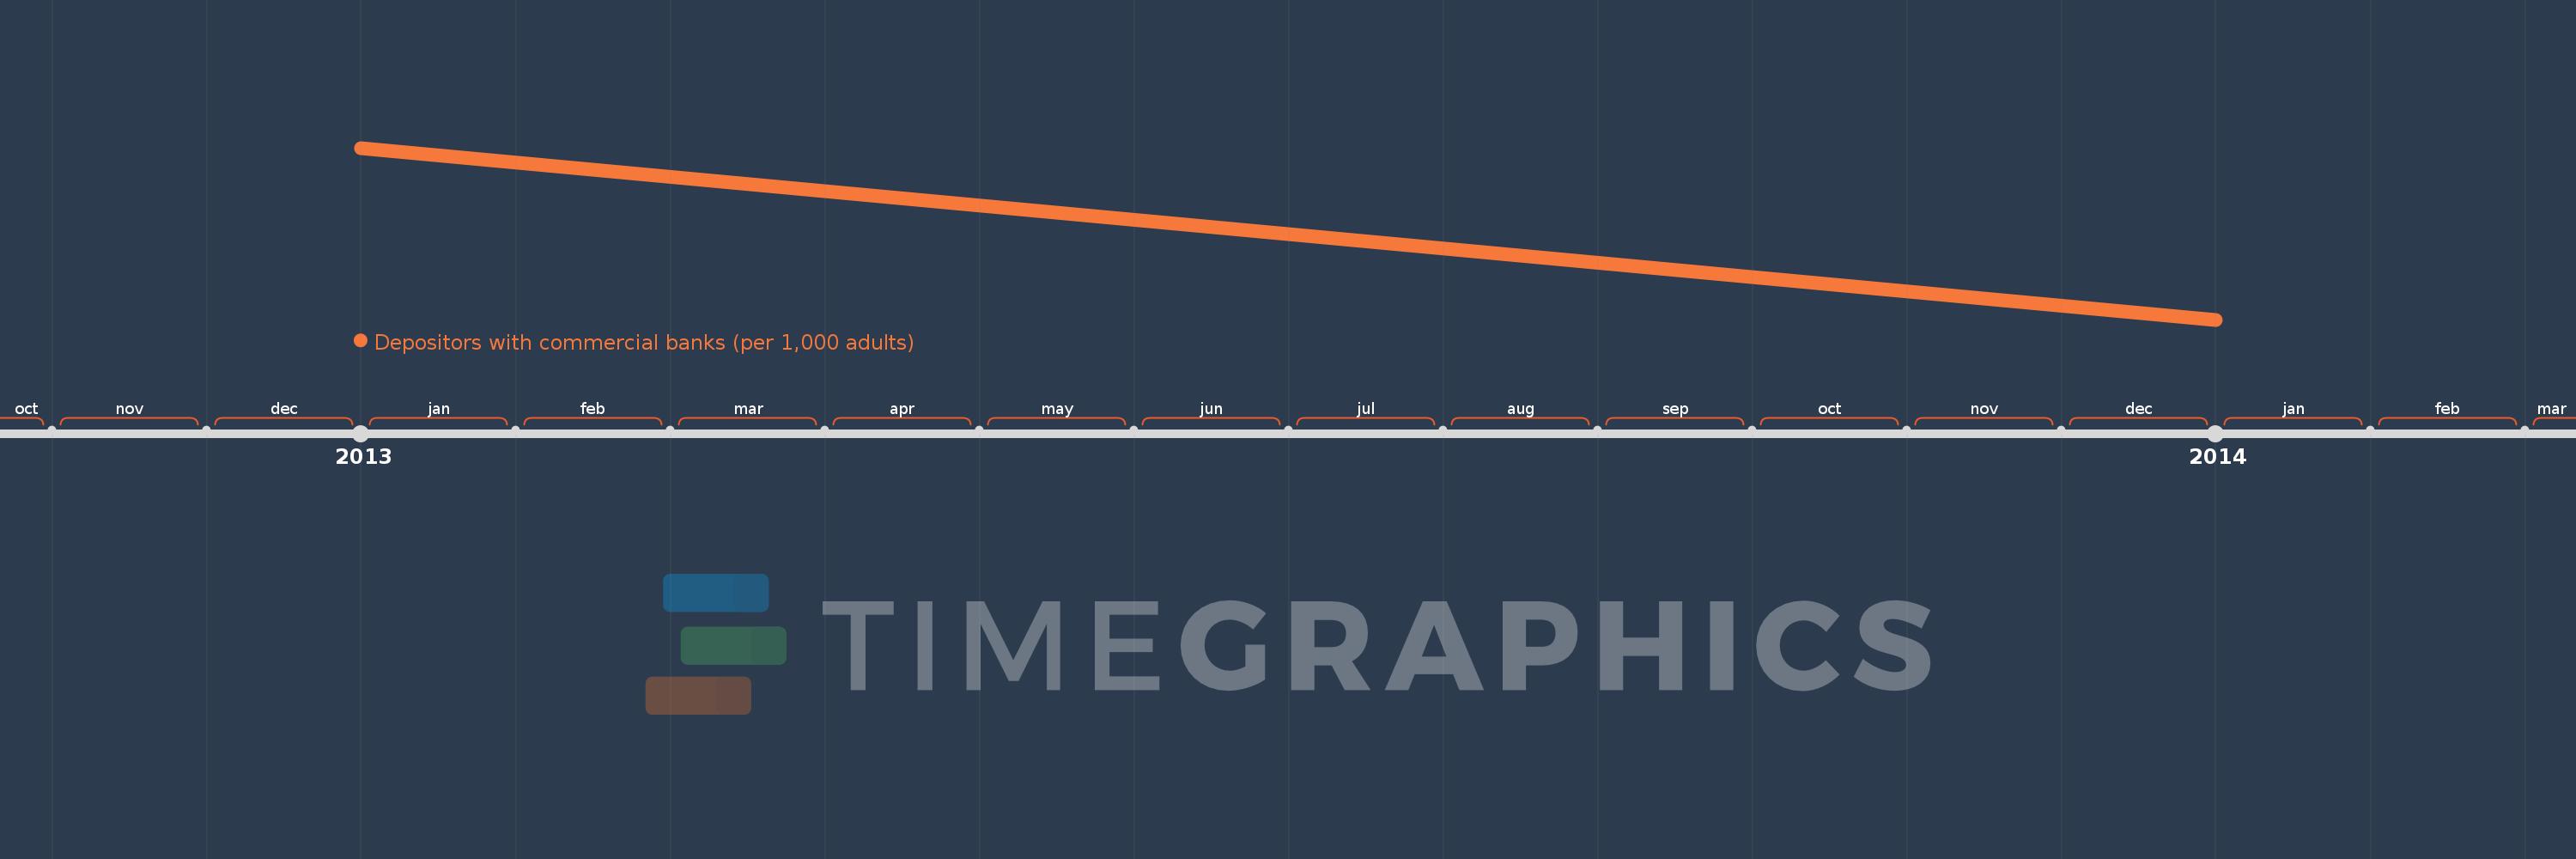
This timeline shows a graph from 2013 to 2014 of World. No data until 2012. Number of actual observations by date: 2.
Source name:
World Development Indicators
Source organization:
International Monetary Fund, Financial Access Survey.
Categories, topics:
Financial Sector
Last updated:
apr 23, 2017
Indicators value changes by year
Minimum:
458.125
jan 1, 2014
Maximum:
459.365
jan 1, 2013
At the date of observation
Value
Absolute change
Change from the previous value
jan 1, 2013
459.365
+459.365
0.0%
jan 1, 2014
458.125
-1.24
-0.27%
Ranking of countries by current statistics by years