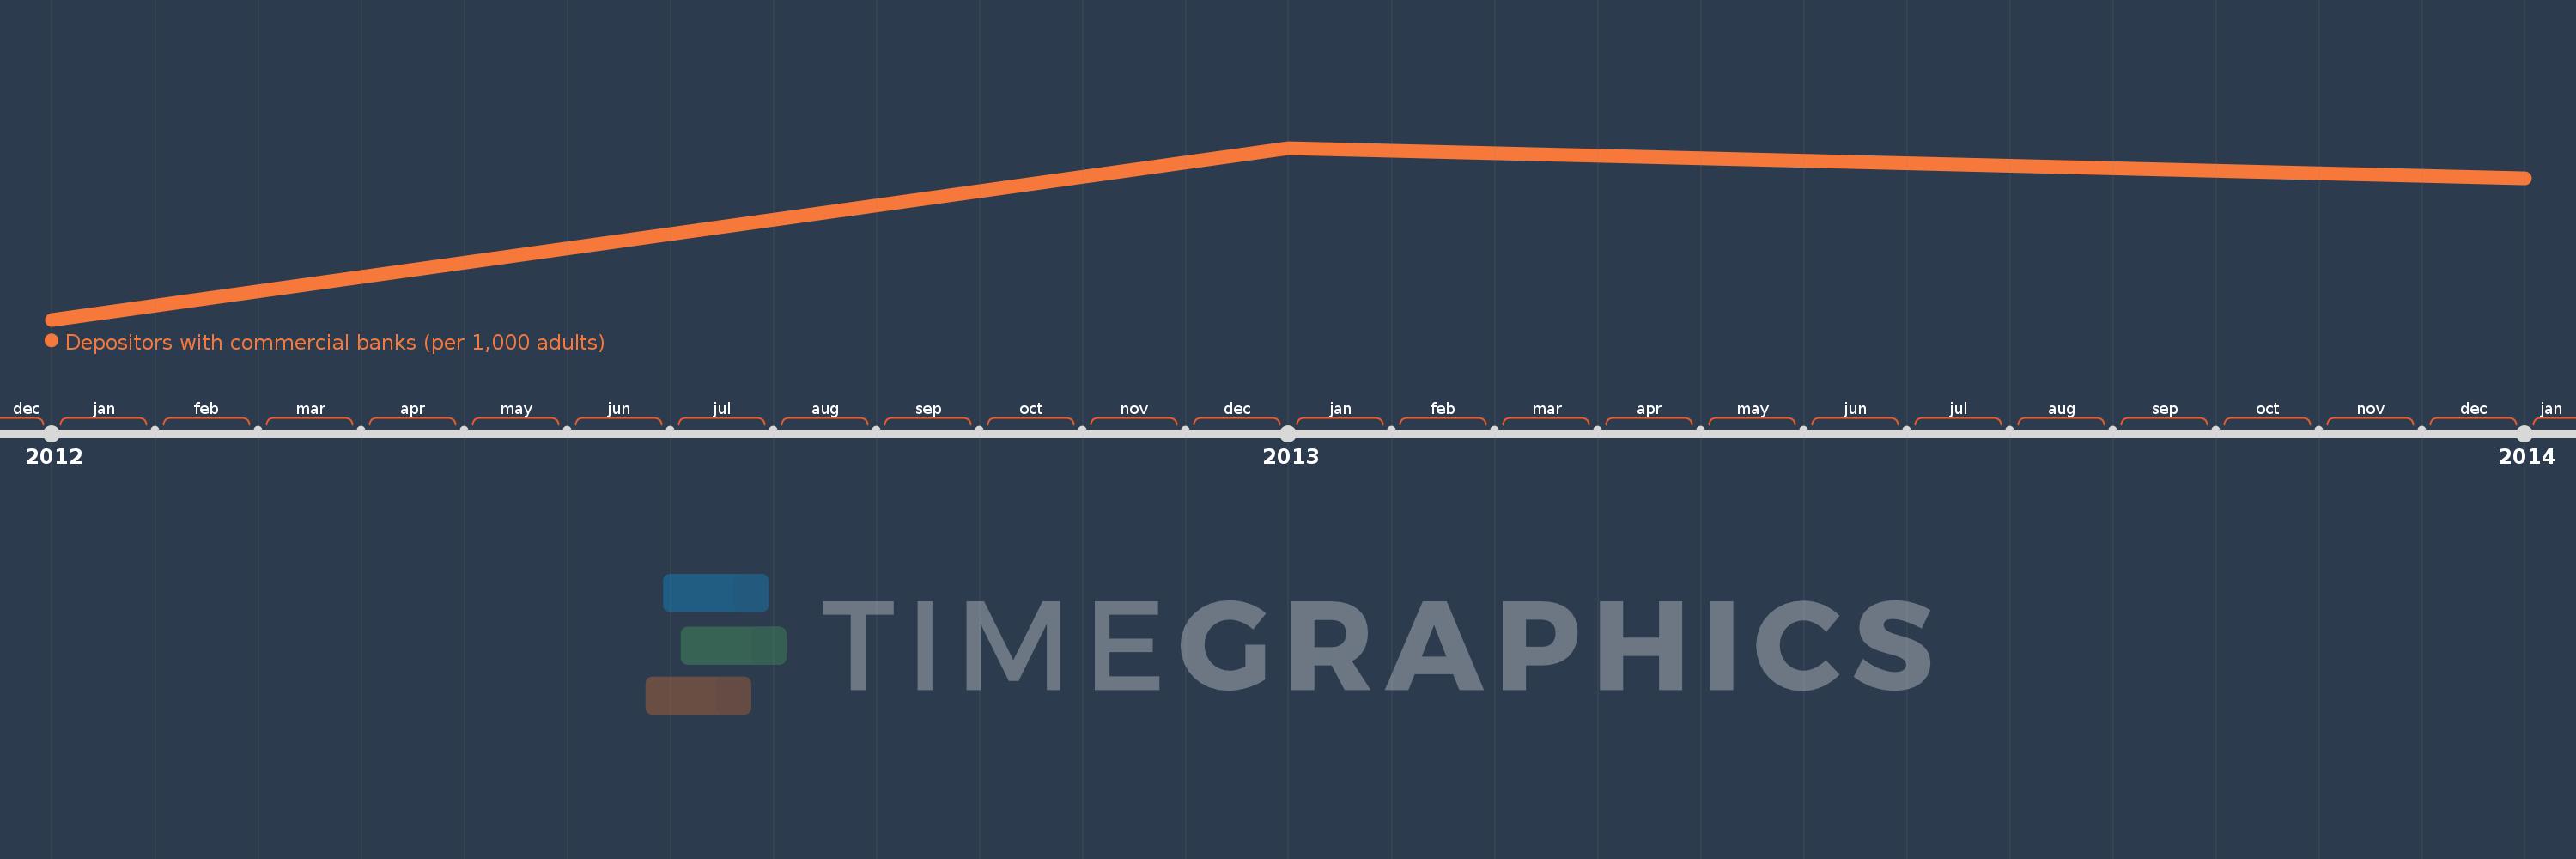
This timeline shows a graph from 2012 to 2014 of Latin America & the Caribbean (IDA & IBRD countries). No data until 2011. Number of actual observations by date: 3.
Source name:
World Development Indicators
Source organization:
International Monetary Fund, Financial Access Survey.
Categories, topics:
Financial Sector
Last updated:
apr 23, 2017
Indicators value changes by year
Meaning:
646.799
Minimum:
612.889
jan 1, 2012
Maximum:
668.645
jan 1, 2013
At the date of observation
Value
Absolute change
Change from the previous value
jan 1, 2012
612.889
+612.889
0.0%
jan 1, 2013
668.645
+55.755
9.1%
jan 1, 2014
658.862
-9.783
-1.46%
Ranking of countries by current statistics by years