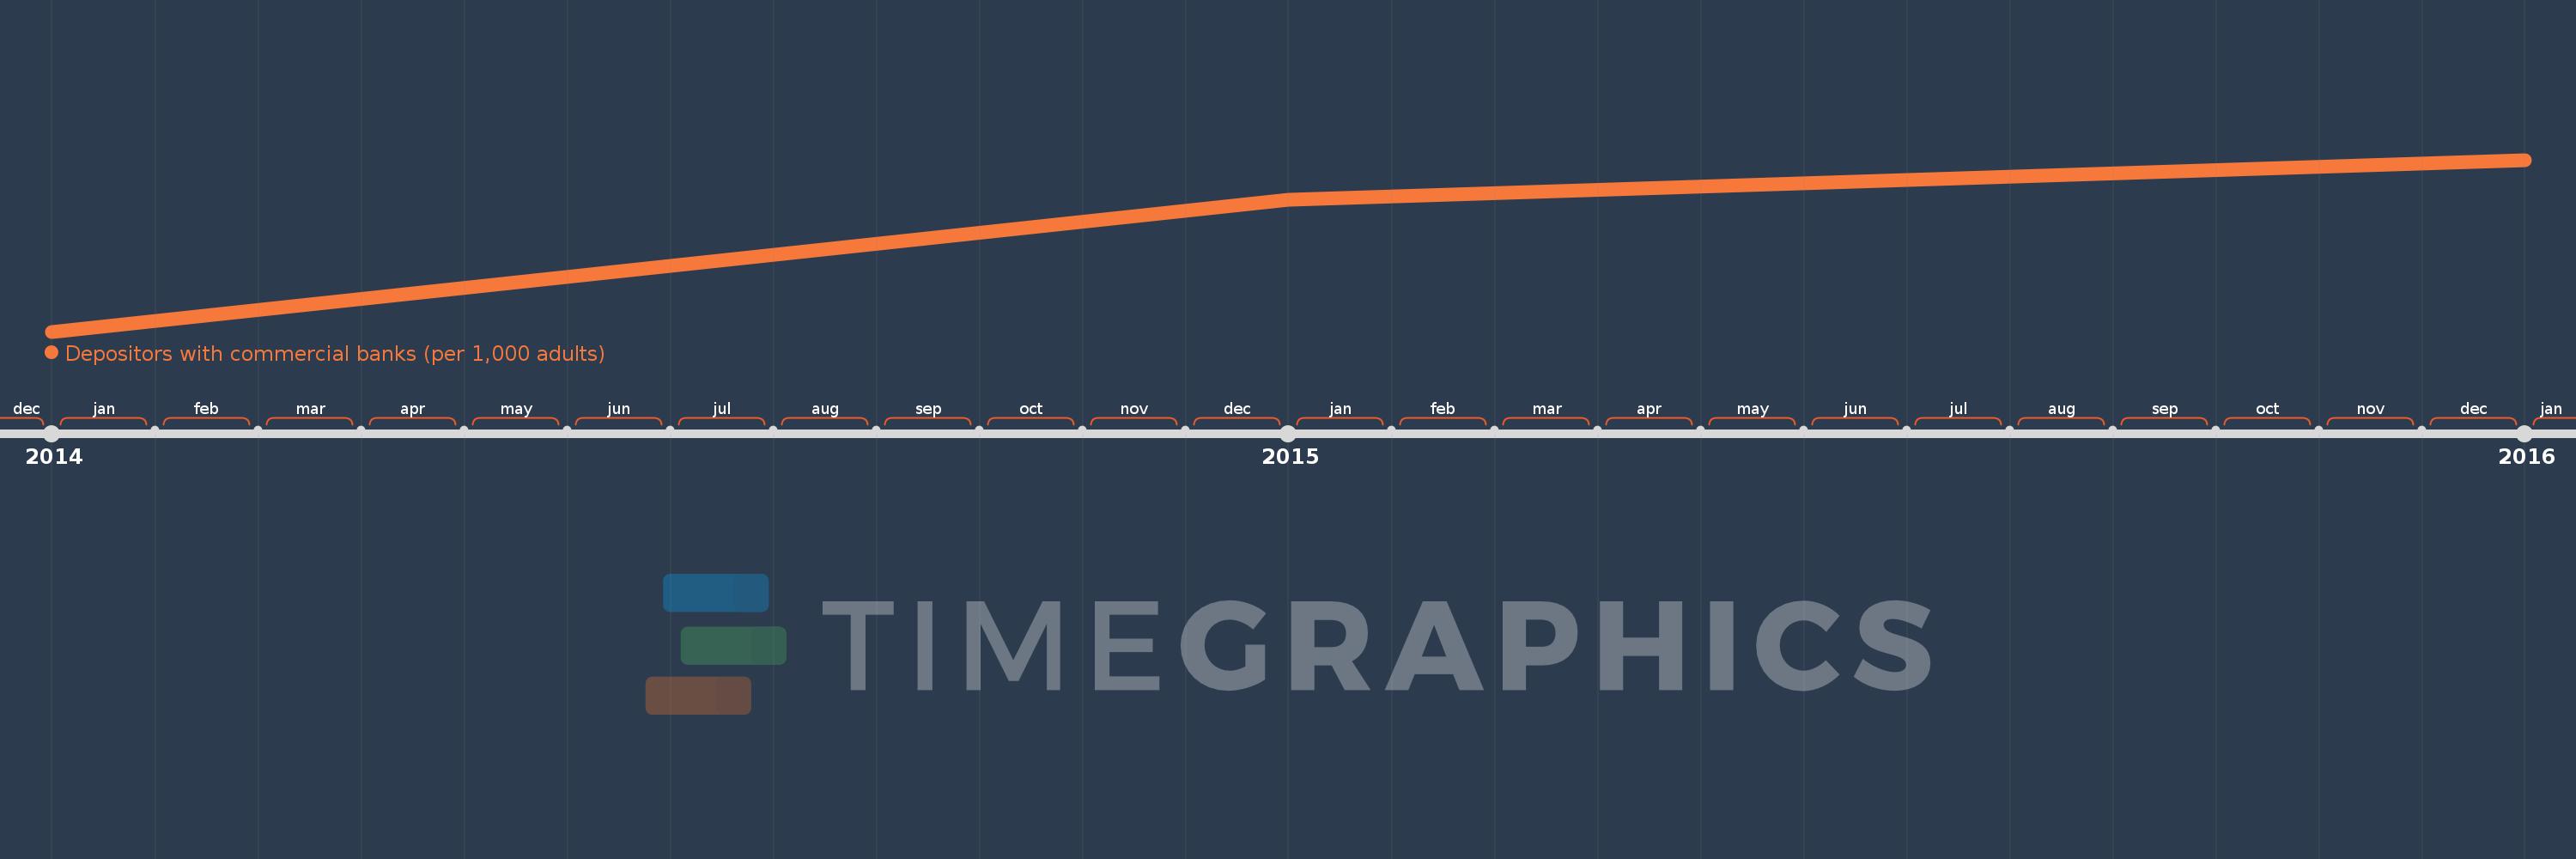
This timeline shows a graph from 2014 to 2016 of East Asia & Pacific (excluding high income). No data until 2013. Number of actual observations by date: 3.
Source name:
World Development Indicators
Source organization:
International Monetary Fund, Financial Access Survey.
Categories, topics:
Financial Sector
Last updated:
apr 23, 2017
Indicators value changes by year
Meaning:
435.413
Minimum:
376.732
jan 1, 2014
Maximum:
476.228
jan 1, 2016
At the date of observation
Value
Absolute change
Change from the previous value
jan 1, 2014
376.732
+376.732
0.0%
jan 1, 2015
453.279
+76.546
20.32%
jan 1, 2016
476.228
+22.949
5.06%
Ranking of countries by current statistics by years