Download This statistics in other country:
Timeline:
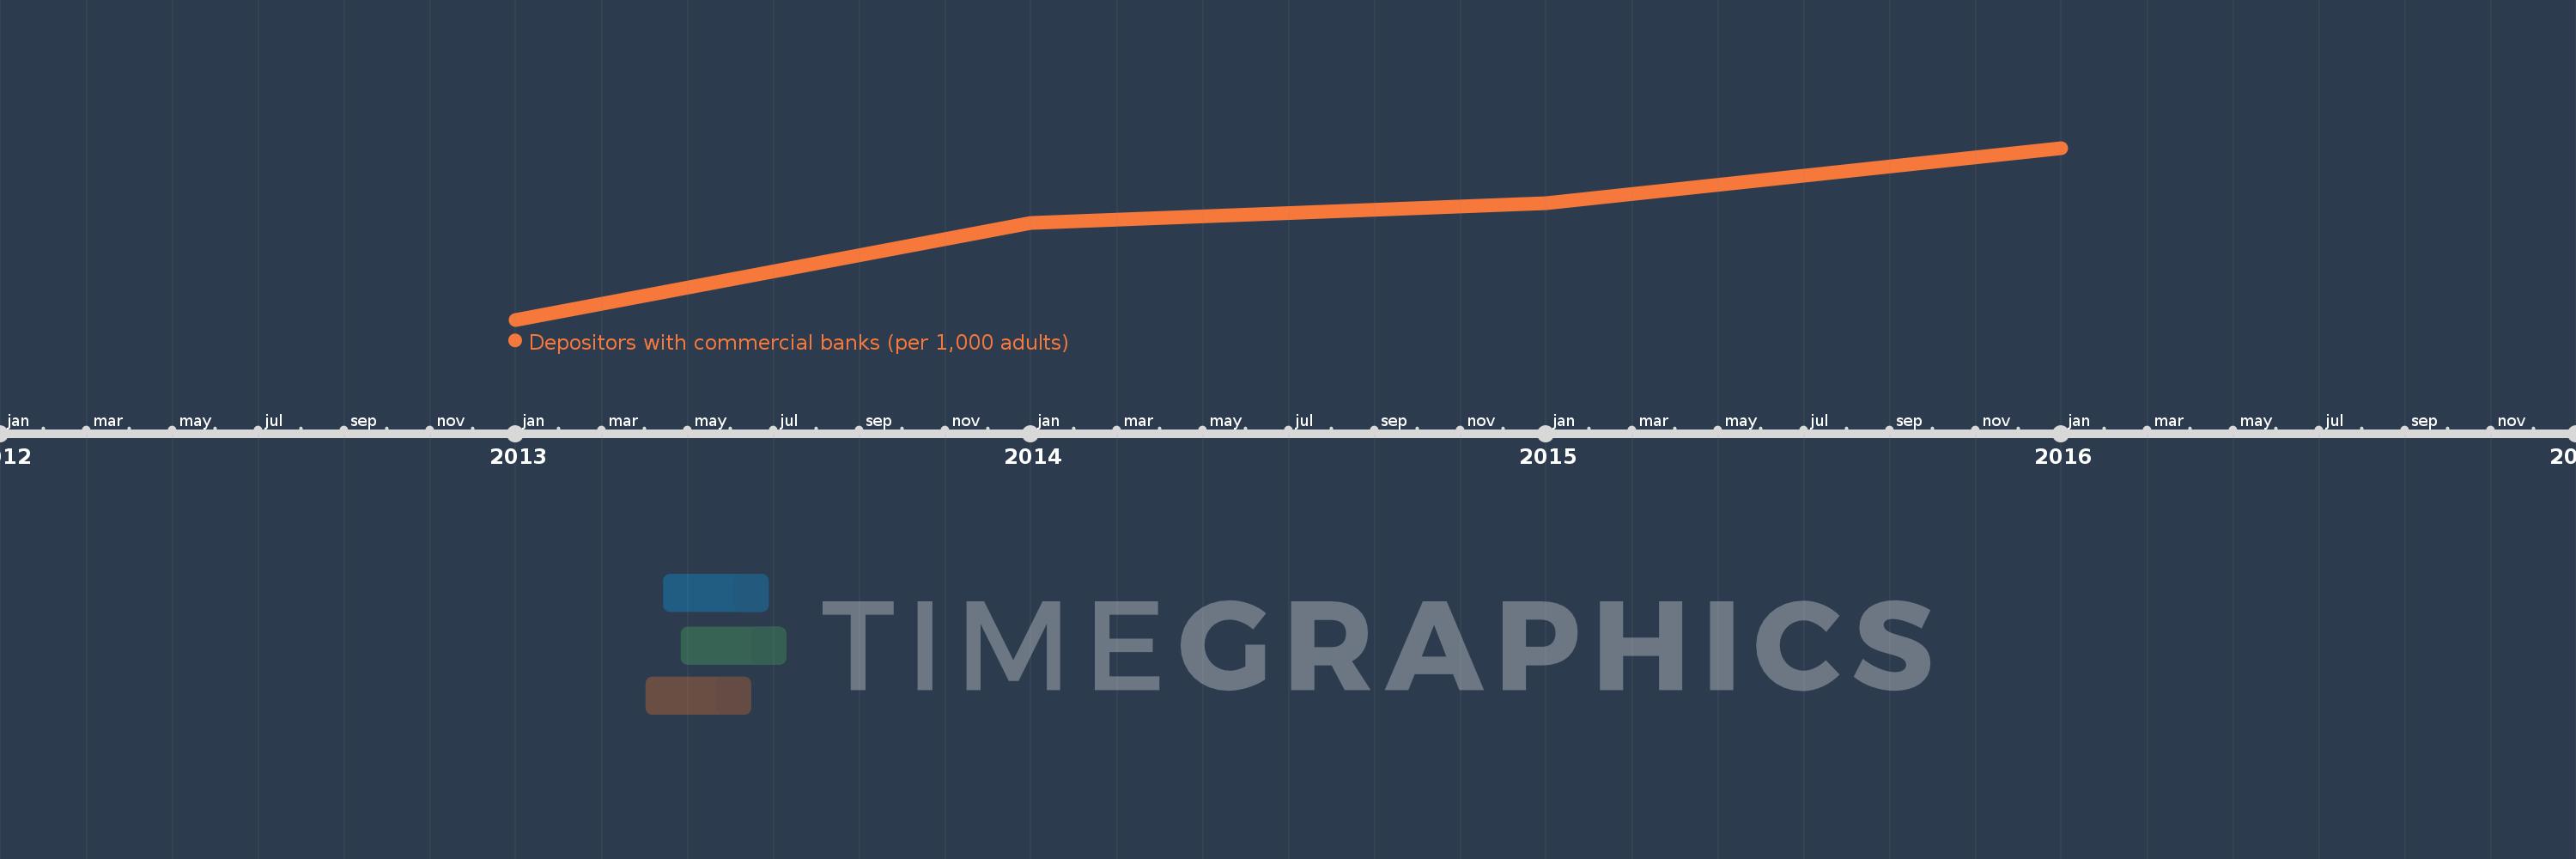
This timeline shows a graph from 2013 to 2016 of Italy. No data until 2012. Number of actual observations by date: 4.
Source name:
World Development Indicators
Source organization:
International Monetary Fund, Financial Access Survey.
Categories, topics:
Financial Sector
Last updated:
apr 23, 2017
Indicators value changes by year
Minimum:
625.935
jan 1, 2013
Maximum:
683.964
jan 1, 2016
At the date of observation
Value
Absolute change
Change from the previous value
jan 1, 2013
625.935
+625.935
0.0%
jan 1, 2014
658.516
+32.581
5.21%
jan 1, 2015
665.309
+6.793
1.03%
jan 1, 2016
683.964
+18.655
2.8%
Ranking of countries by current statistics by years