Download This statistics in other country:
Timeline:
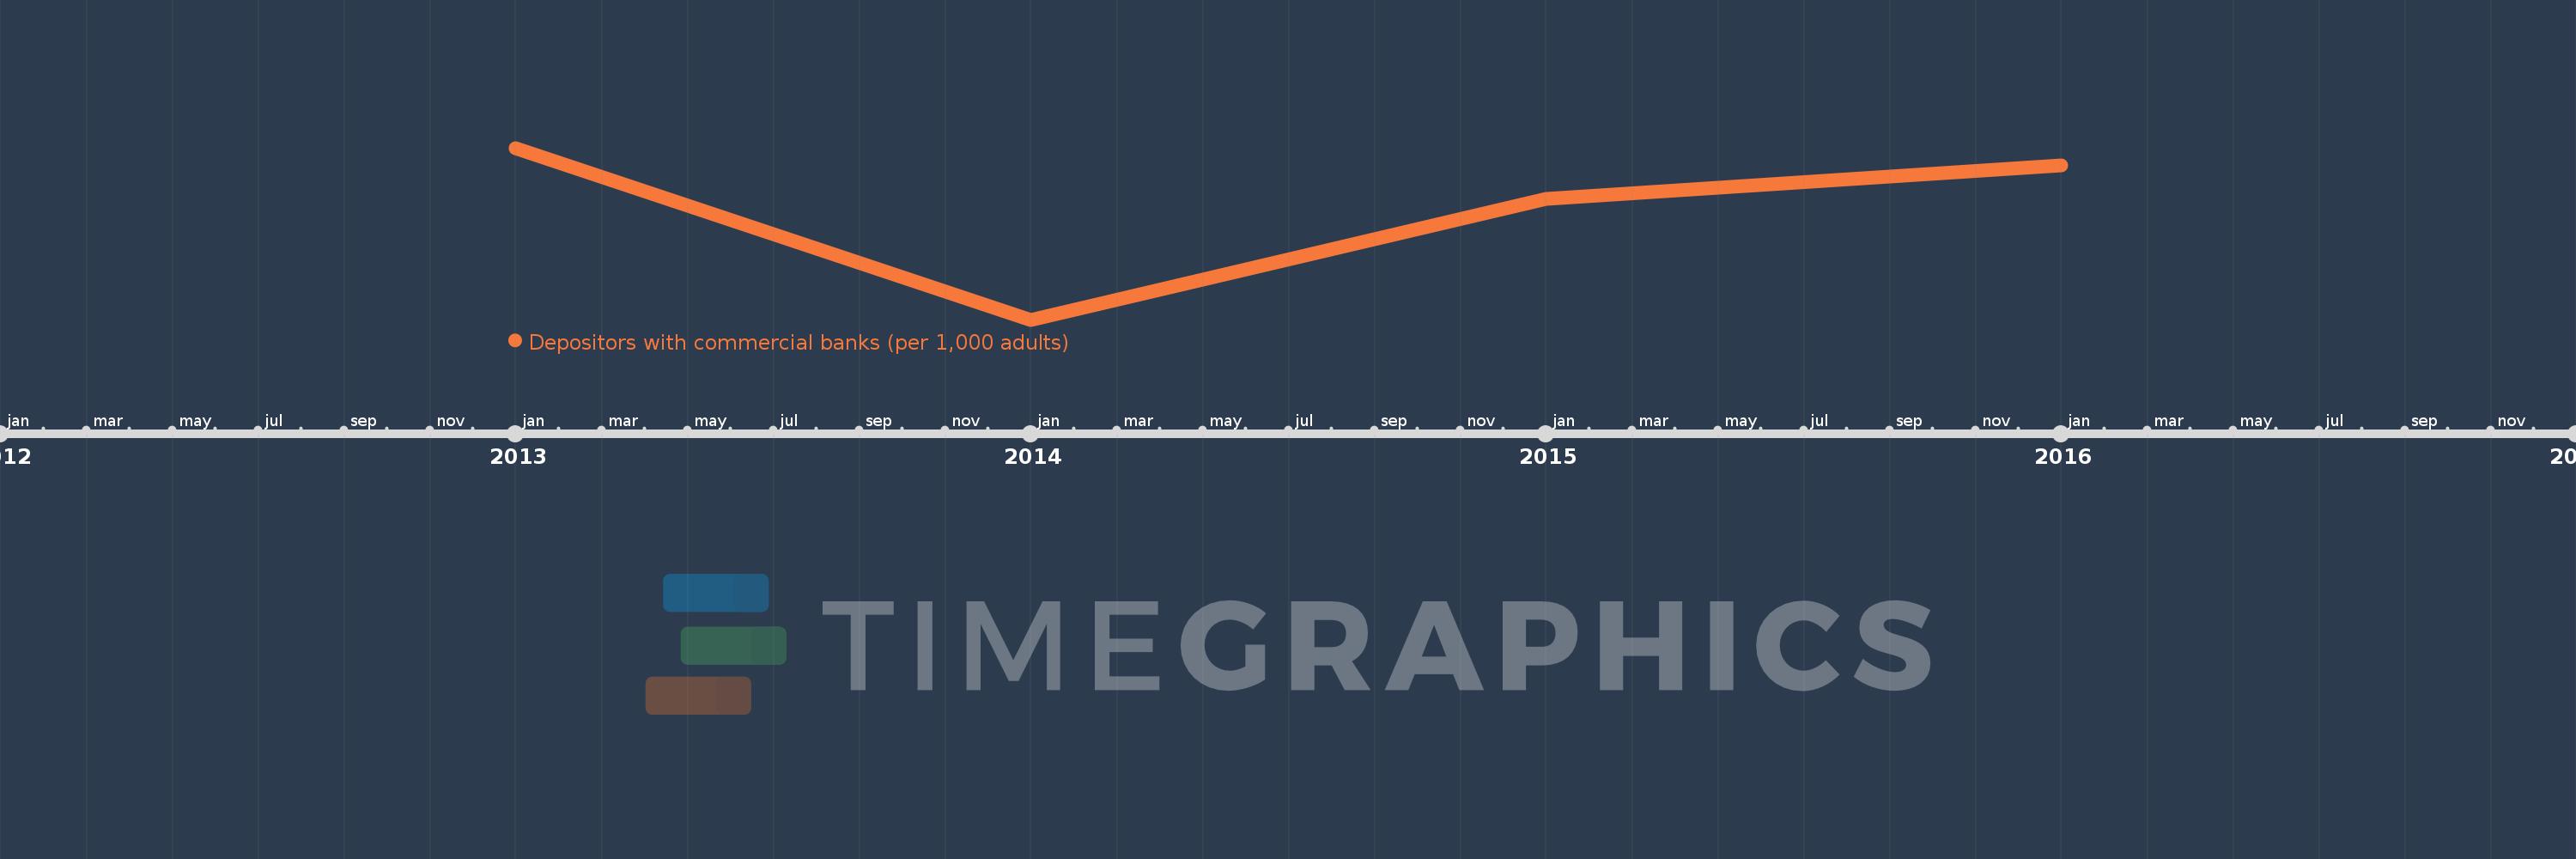
This timeline shows a graph from 2013 to 2016 of Hungary. No data until 2012. Number of actual observations by date: 4.
Source name:
World Development Indicators
Source organization:
International Monetary Fund, Financial Access Survey.
Categories, topics:
Financial Sector
Last updated:
apr 23, 2017
Indicators value changes by year
Minimum:
980.109
jan 1, 2014
Maximum:
1.031K
jan 1, 2013
At the date of observation
Value
Absolute change
Change from the previous value
jan 1, 2013
1.031K
+1.031K
0.0%
jan 1, 2014
980.109
-50.794
-4.93%
jan 1, 2015
1.016K
+35.802
3.65%
jan 1, 2016
1.026K
+9.74
0.96%
Ranking of countries by current statistics by years