Download This statistics in other country:
Timeline:
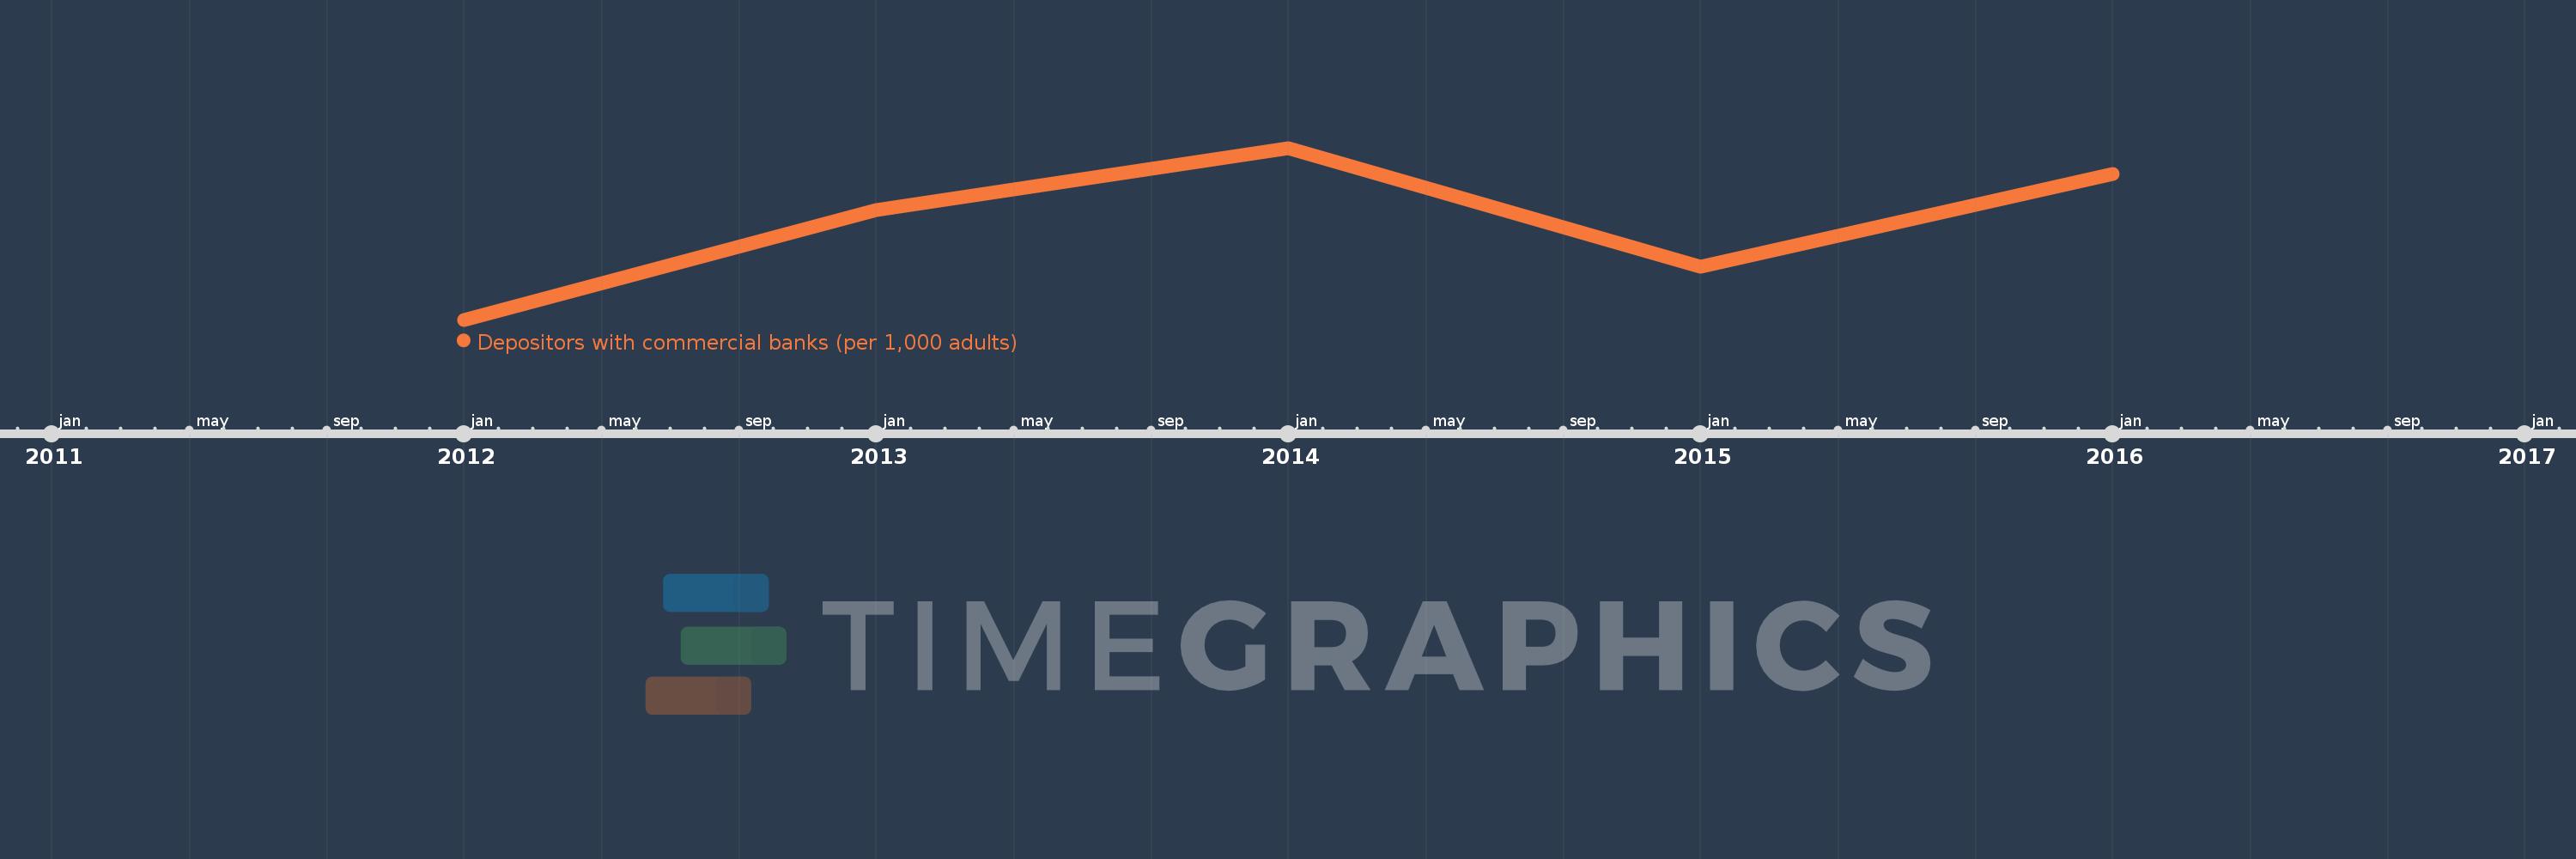
This timeline shows a graph from 2012 to 2016 of Egypt, Arab Rep.. No data until 2011. Number of actual observations by date: 5.
Source name:
World Development Indicators
Source organization:
International Monetary Fund, Financial Access Survey.
Categories, topics:
Financial Sector
Last updated:
apr 23, 2017
Indicators value changes by year
Minimum:
351.906
jan 1, 2012
Maximum:
372.568
jan 1, 2014
At the date of observation
Value
Absolute change
Change from the previous value
jan 1, 2012
351.906
+351.906
0.0%
jan 1, 2013
365.132
+13.227
3.76%
jan 1, 2014
372.568
+7.435
2.04%
jan 1, 2015
358.264
-14.303
-3.84%
jan 1, 2016
369.487
+11.223
3.13%
Ranking of countries by current statistics by years