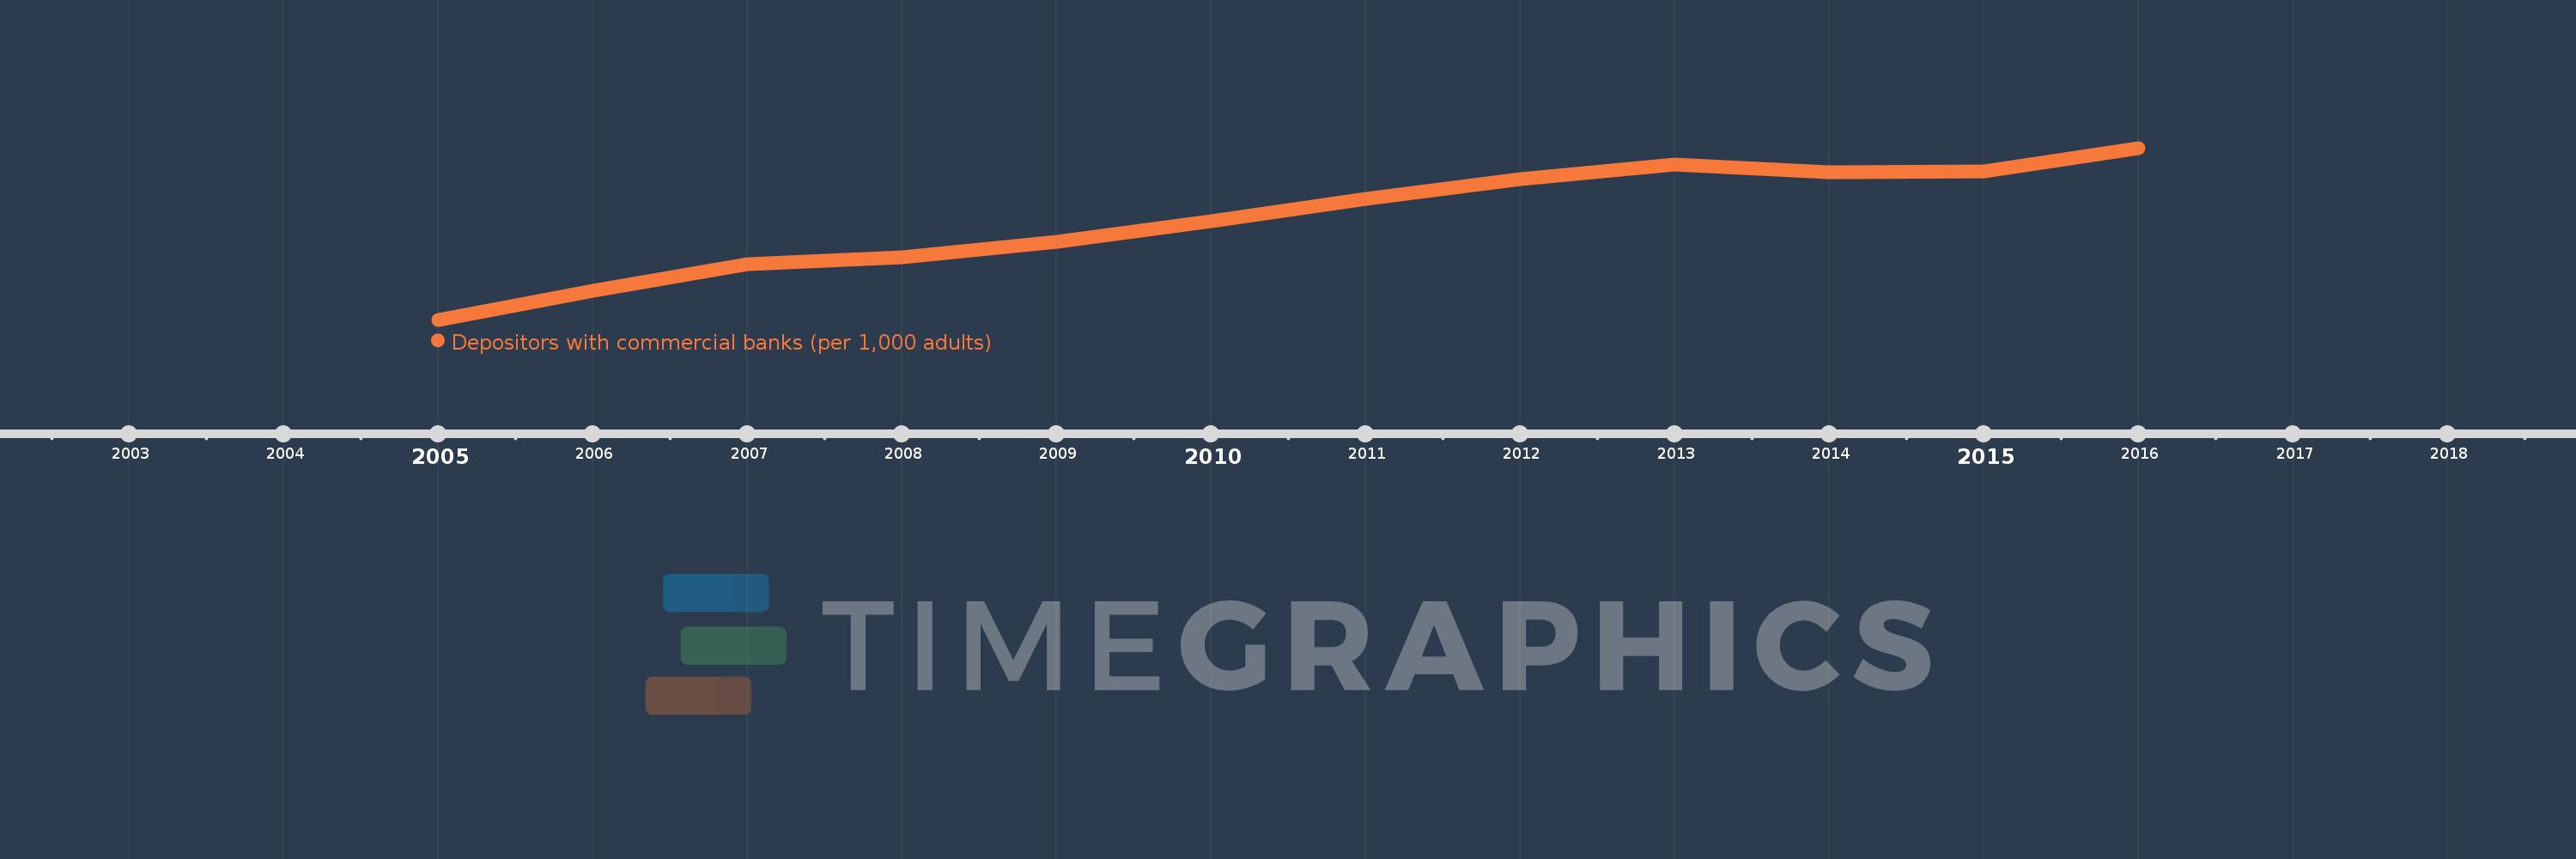
This timeline shows a graph from 2005 to 2016 of Heavily indebted poor countries (HIPC). No data until 2004. Number of actual observations by date: 12.
Source name:
World Development Indicators
Source organization:
International Monetary Fund, Financial Access Survey.
Categories, topics:
Financial Sector
Last updated:
apr 23, 2017
Indicators value changes by year
Meaning:
91.534
Minimum:
17.709
jan 1, 2005
Maximum:
143.728
jan 1, 2016
At the date of observation
Value
Absolute change
Change from the previous value
jan 1, 2005
17.709
+17.709
0.0%
jan 1, 2006
38.879
+21.171
119.55%
jan 1, 2007
58.398
+19.518
50.2%
jan 1, 2008
63.342
+4.944
8.47%
jan 1, 2009
74.723
+11.381
17.97%
jan 1, 2010
90.276
+15.553
20.81%
jan 1, 2011
106.472
+16.196
17.94%
jan 1, 2012
120.757
+14.284
13.42%
jan 1, 2013
131.532
+10.776
8.92%
jan 1, 2014
126.046
-5.487
-4.17%
jan 1, 2015
126.55
+0.504
0.4%
jan 1, 2016
143.728
+17.179
13.57%
Ranking of countries by current statistics by years