Download This statistics in other country:
Timeline:
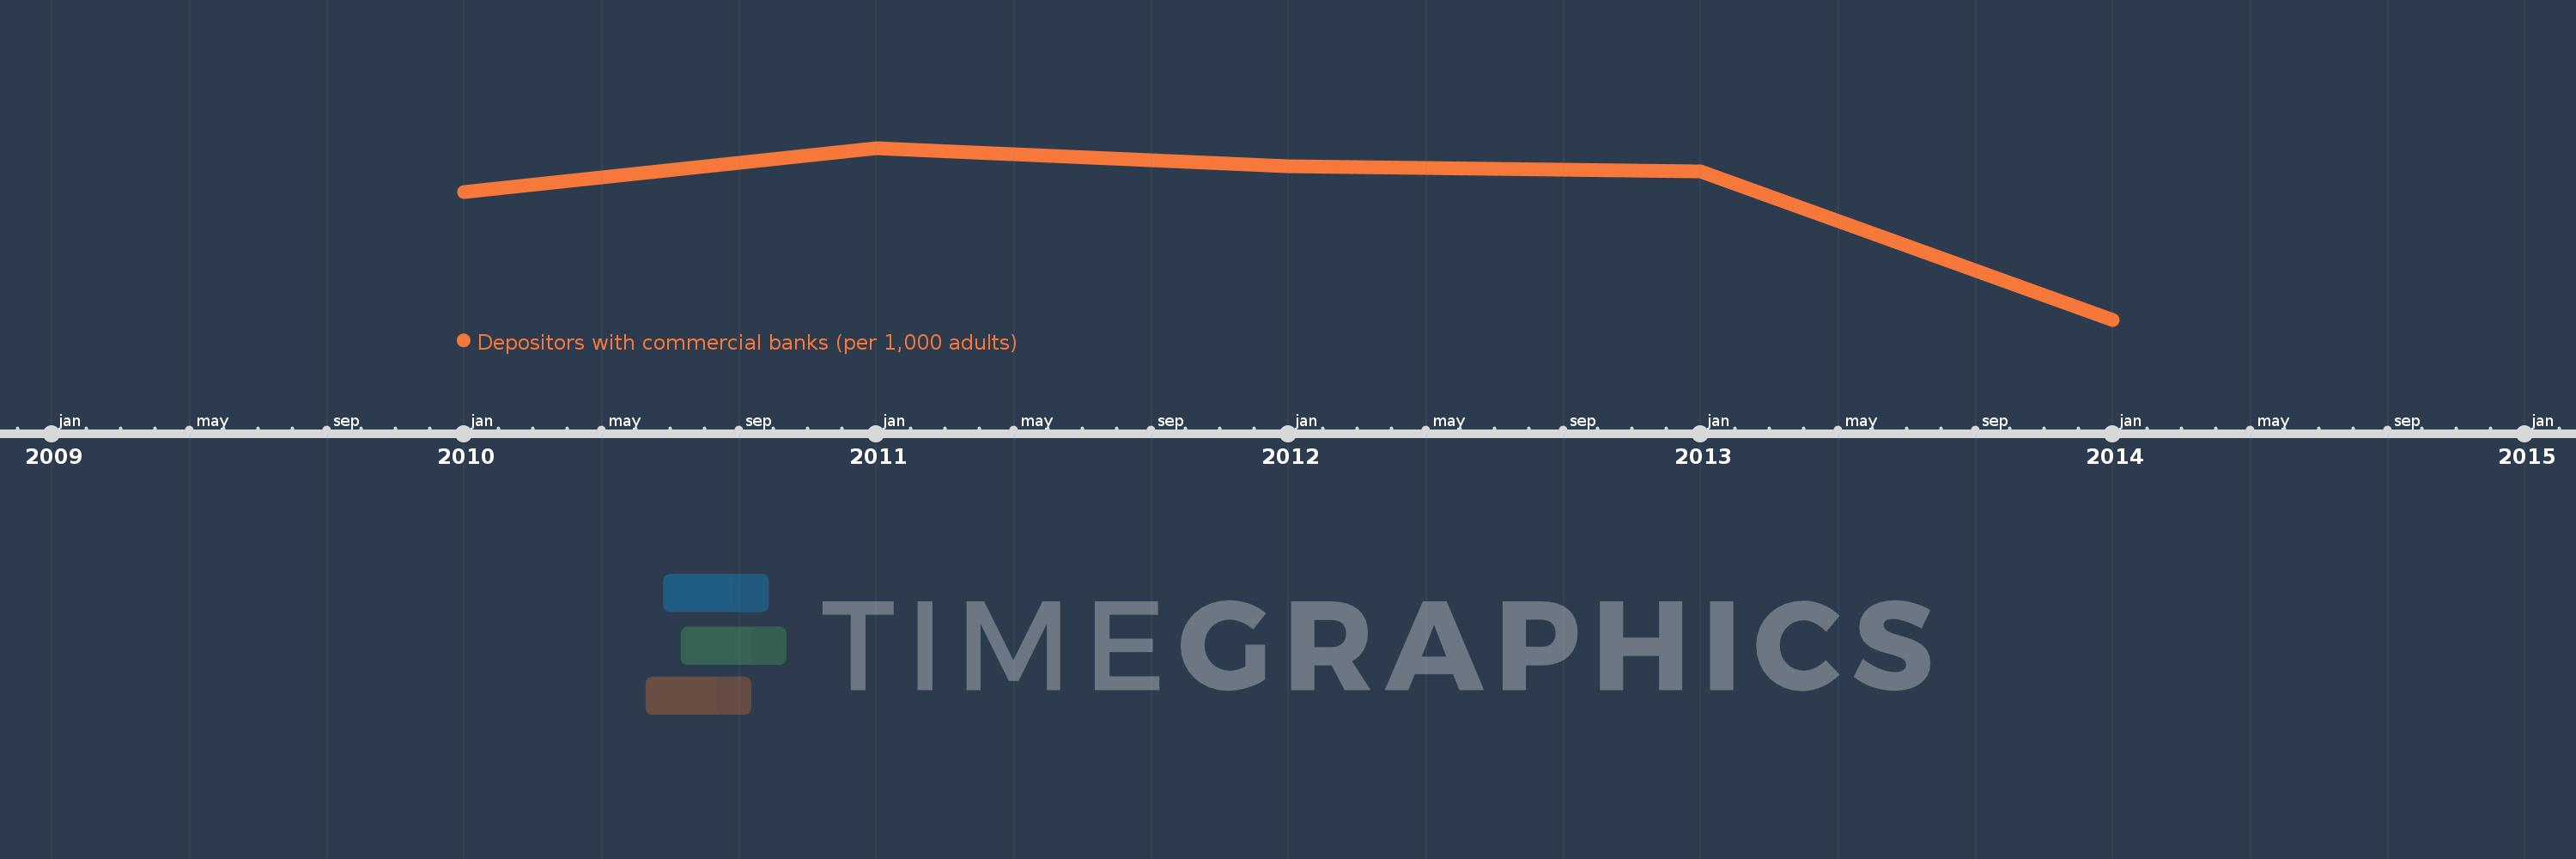
This timeline shows a graph from 2010 to 2014 of Middle East & North Africa (excluding high income). No data until 2009. Number of actual observations by date: 5.
Source name:
World Development Indicators
Source organization:
International Monetary Fund, Financial Access Survey.
Categories, topics:
Financial Sector
Last updated:
apr 23, 2017
Indicators value changes by year
Minimum:
477.187
jan 1, 2014
Maximum:
638.254
jan 1, 2011
At the date of observation
Value
Absolute change
Change from the previous value
jan 1, 2010
597.214
+597.214
0.0%
jan 1, 2011
638.254
+41.04
6.87%
jan 1, 2012
621.219
-17.035
-2.67%
jan 1, 2013
616.356
-4.863
-0.78%
jan 1, 2014
477.187
-139.168
-22.58%
Ranking of countries by current statistics by years