33
/
AIzaSyAYiBZKx7MnpbEhh9jyipgxe19OcubqV5w
August 1, 2025
48026
Middle East & North Africa
MEA
false
2
1
Depositors with commercial banks (per 1,000 adults)
2014,2013,2012,2011,2010
Download
Global statistics library →Middle East & North Africa →

Depositors with commercial banks (per 1,000 adults)

This statistics in other country:

AfghanistanAngolaArab WorldArgentinaAzerbaijanBangladeshBelizeBeninBotswanaBrazilBrunei DarussalamBurkina FasoBurundiCabo VerdeCameroonCentral African RepublicChadChinaColombiaComorosCongo, Dem. Rep.Congo, Rep.Costa RicaCote d'IvoireCroatiaDjiboutiDominican RepublicEarly-demographic dividendEast Asia & Pacific (excluding high income)East Asia & Pacific (IDA & IBRD countries)EcuadorEgypt, Arab Rep.Equatorial GuineaEstoniaEthiopiaFragile and conflict affected situationsGabonGeorgiaGhanaGuineaGuinea-BissauHaitiHeavily indebted poor countries (HIPC)HungaryIBRD onlyIDA & IBRD totalIDA blendIDA onlyIDA totalIsraelItalyKenyaKiribatiKuwaitKyrgyz RepublicLao PDRLatin America & Caribbean (excluding high income)Latin America & the Caribbean (IDA & IBRD countries)LatviaLeast developed countries: UN classificationLebanonLesothoLibyaLow & middle incomeLow incomeLower middle incomeMadagascarMalawiMalaysiaMaldivesMaliMaltaMauritaniaMiddle East & North AfricaMiddle East & North Africa (excluding high income)Middle East & North Africa (IDA & IBRD countries)Middle incomeMoldovaMyanmarNamibiaNigerNigeriaNorwayOther small statesPakistanPalauParaguayPeruPhilippinesPolandPre-demographic dividendQatarRwandaSamoaSan MarinoSao Tome and PrincipeSaudi ArabiaSenegalSeychellesSierra LeoneSingaporeSmall statesSolomon IslandsSouth AsiaSouth Asia (IDA & IBRD)South SudanSub-Saharan Africa Sub-Saharan Africa (excluding high income)Sub-Saharan Africa (IDA & IBRD countries)SurinameSwazilandSyrian Arab RepublicTajikistanTanzaniaThailandTimor-LesteTogoTunisiaTurkeyUgandaUkraineUpper middle incomeUruguayUzbekistanVanuatuVenezuela, RBWest Bank and GazaWorldYemen, Rep.ZambiaZimbabwe

Timeline:

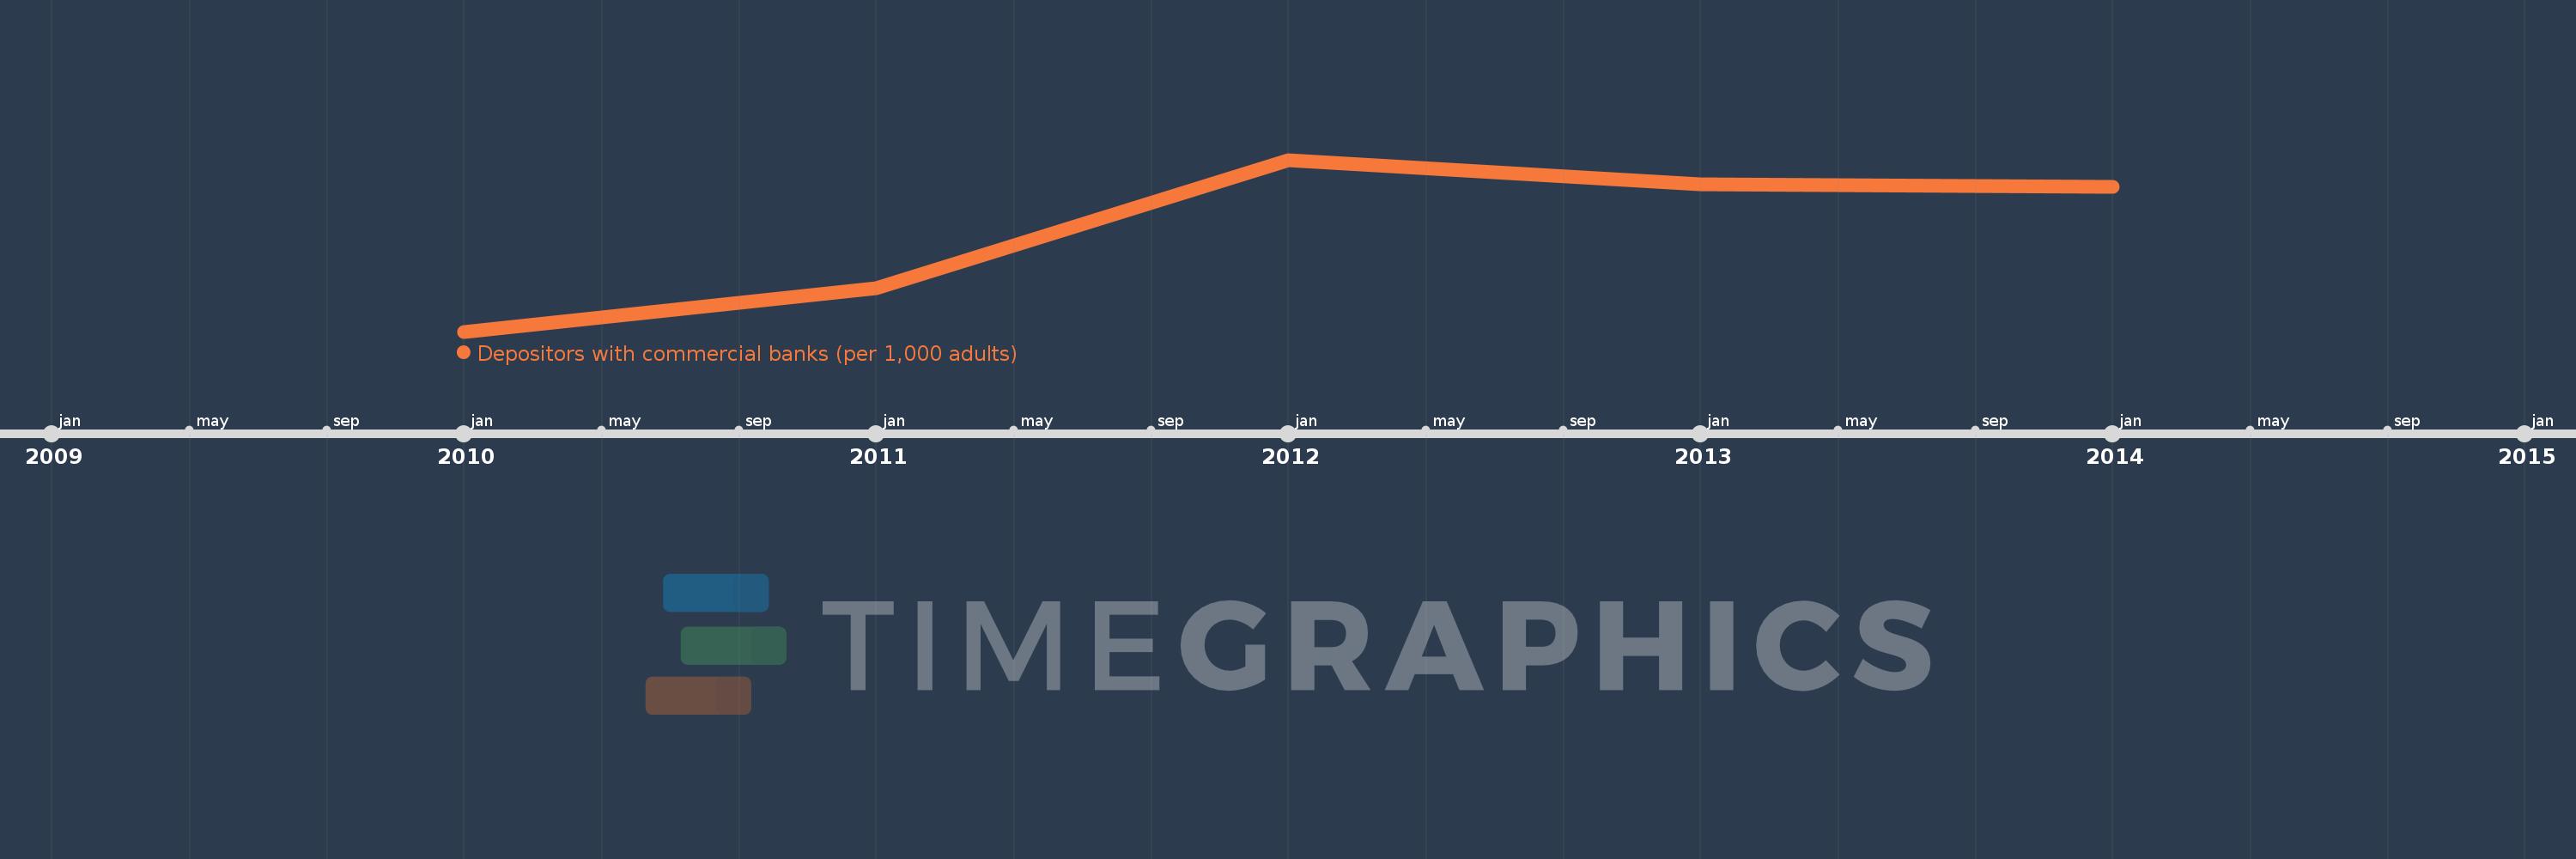
This timeline shows a graph from 2010 to 2014 of Middle East & North Africa. No data until 2009. Number of actual observations by date: 5.

Source name:

World Development Indicators

Source organization:

International Monetary Fund, Financial Access Survey.

Categories, topics:

Financial Sector

Last updated:

apr 23, 2017

Indicators value changes by year

Meaning:
688.459
Minimum:
656.853
jan 1, 2010
Maximum:
710.42
jan 1, 2012
At the date of observation
Value
Absolute change
Change from the previous value
jan 1, 2010
656.853
+656.853
0.0%
jan 1, 2011
670.46
+13.607
2.07%
jan 1, 2012
710.42
+39.96
5.96%
jan 1, 2013
702.664
-7.755
-1.09%
jan 1, 2014
701.897
-0.767
-0.11%

Ranking of countries by current statistics by years