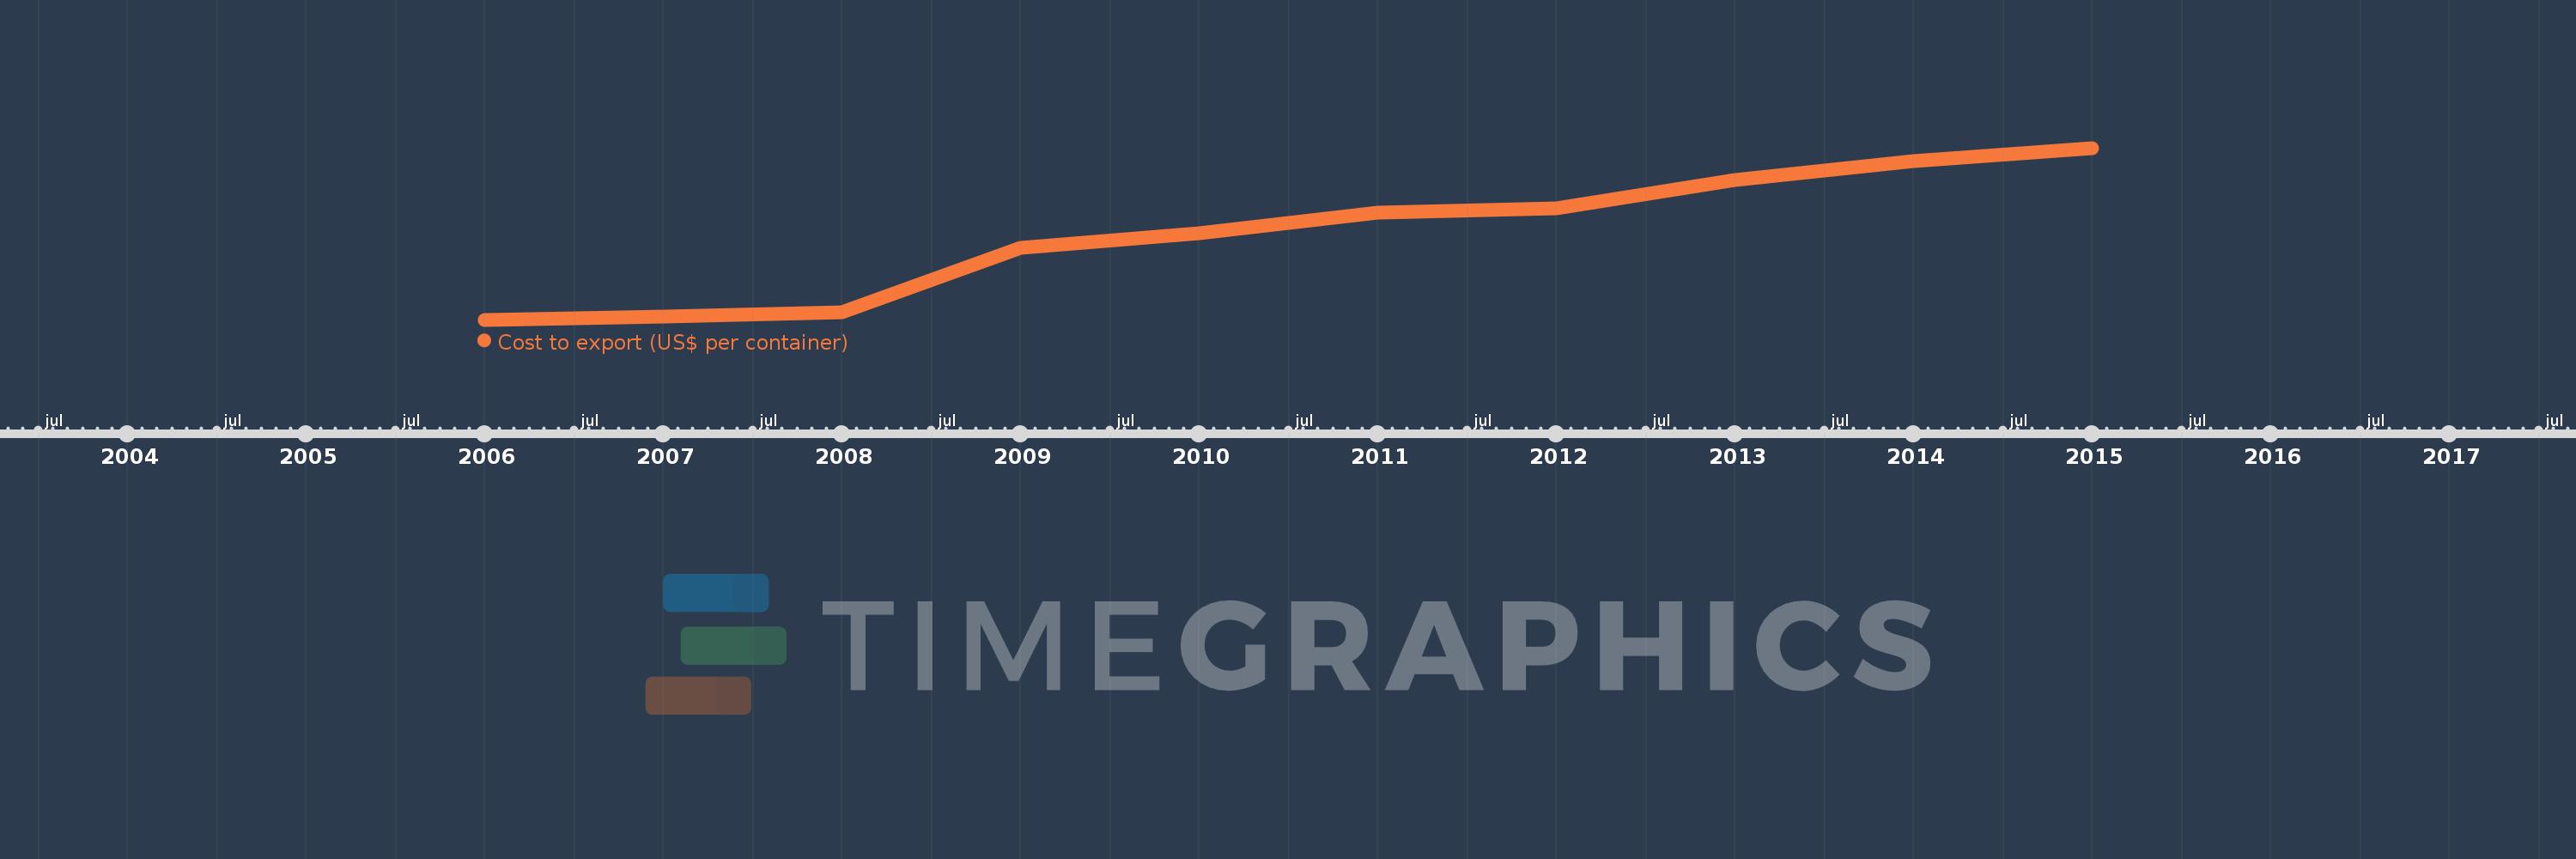
This timeline shows a graph from 2006 to 2015 of Sub-Saharan Africa (IDA & IBRD countries). No data until 2005. Number of actual observations by date: 10.
Source name:
World Development Indicators
Source organization:
World Bank, Doing Business project (http://www.doingbusiness.org/).
Categories, topics:
Private Sector, Trade
Last updated:
apr 23, 2017
Indicators value changes by year
Meaning:
1.913K
Minimum:
1.627K
jan 1, 2006
Maximum:
2.201K
jan 1, 2015
At the date of observation
Value
Absolute change
Change from the previous value
jan 1, 2006
1.627K
+1.627K
0.0%
jan 1, 2007
1.637K
+9.883
0.61%
jan 1, 2008
1.651K
+13.978
0.85%
jan 1, 2009
1.866K
+215.126
13.03%
jan 1, 2010
1.915K
+49.428
2.65%
jan 1, 2011
1.986K
+70.783
3.7%
jan 1, 2012
1.998K
+12.348
0.62%
jan 1, 2013
2.093K
+94.759
4.74%
jan 1, 2014
2.156K
+62.498
2.99%
jan 1, 2015
2.201K
+45.0
2.09%
Ranking of countries by current statistics by years