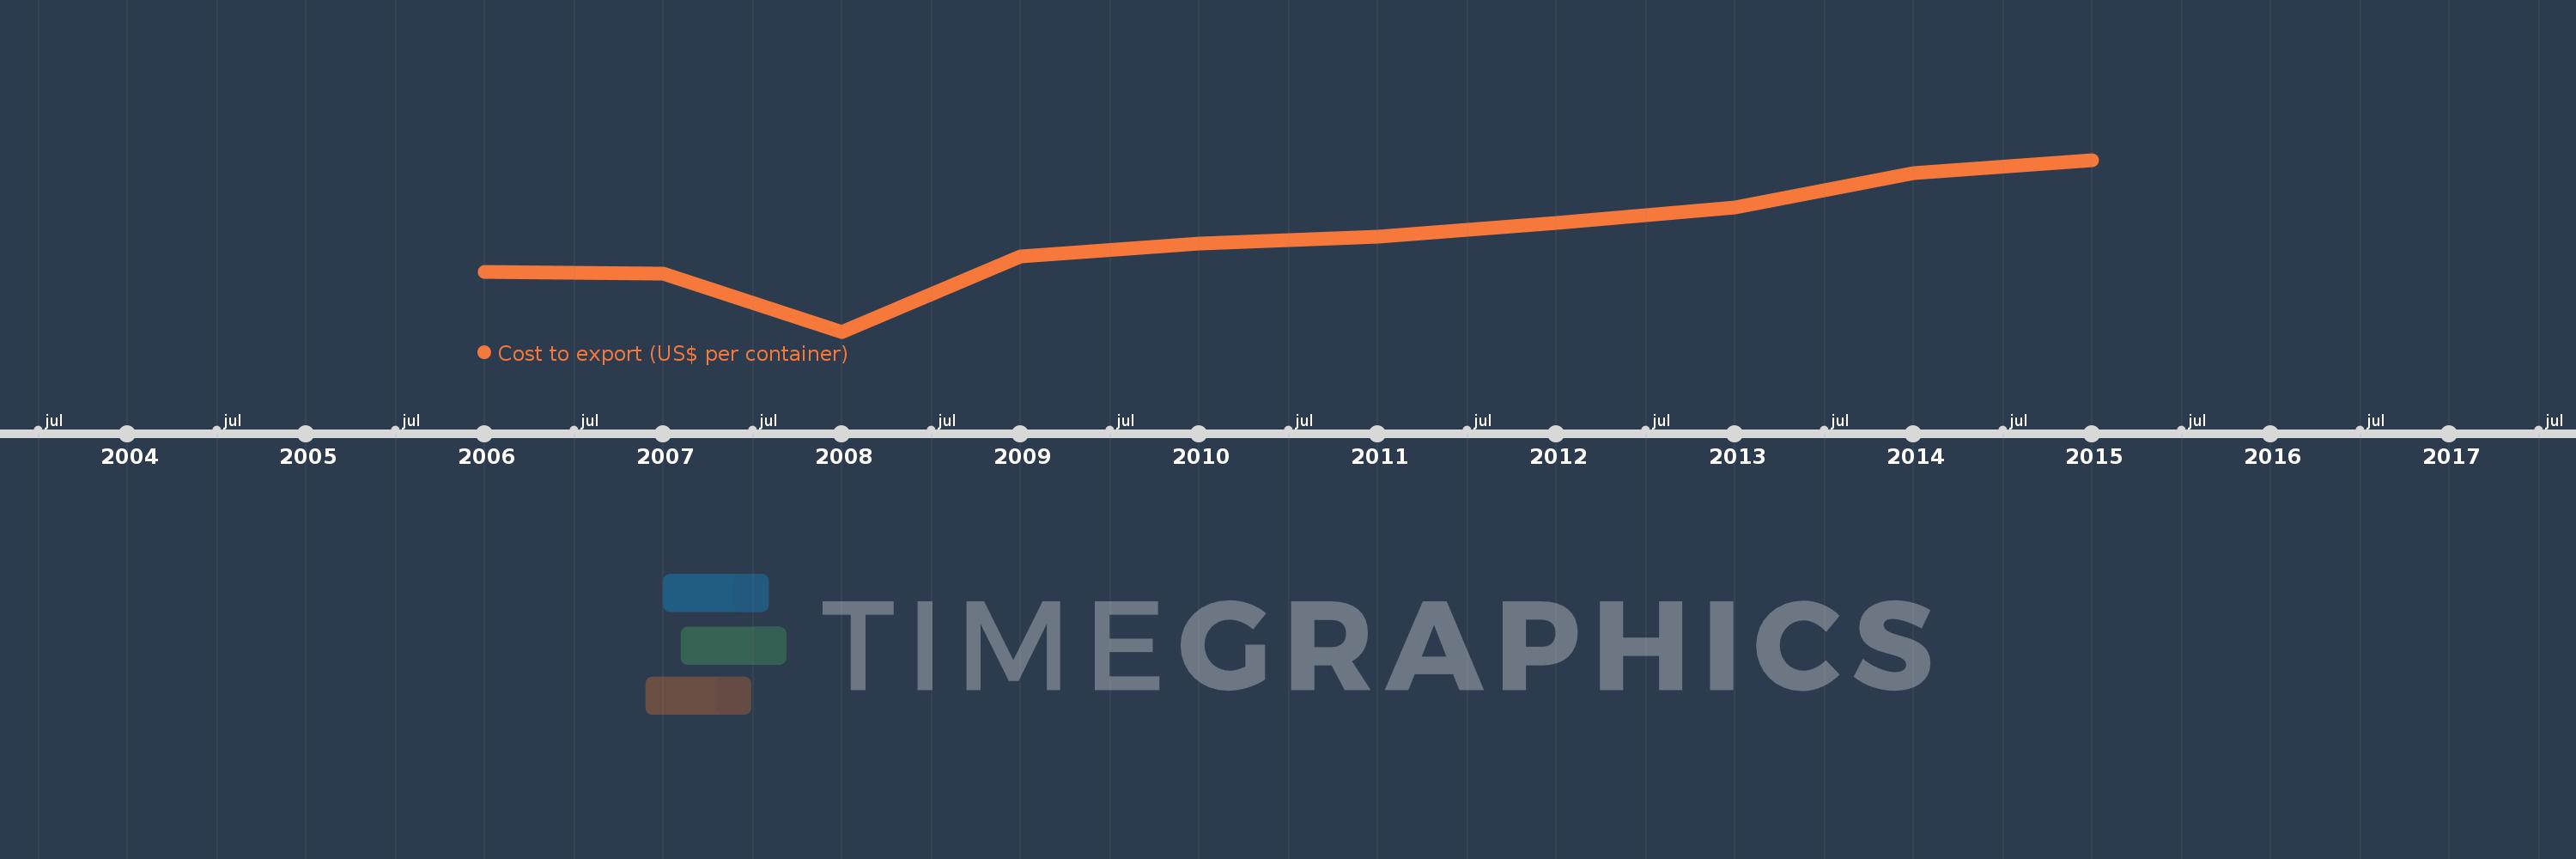
This timeline shows a graph from 2006 to 2015 of Middle East & North Africa (excluding high income). No data until 2005. Number of actual observations by date: 10.
Source name:
World Development Indicators
Source organization:
World Bank, Doing Business project (http://www.doingbusiness.org/).
Categories, topics:
Private Sector, Trade
Last updated:
apr 23, 2017
Indicators value changes by year
Meaning:
1.192K
Minimum:
1.059K
jan 1, 2008
Maximum:
1.303K
jan 1, 2015
At the date of observation
Value
Absolute change
Change from the previous value
jan 1, 2006
1.144K
+1.144K
0.0%
jan 1, 2007
1.141K
-3.333
-0.29%
jan 1, 2008
1.059K
-81.667
-7.16%
jan 1, 2009
1.166K
+106.667
10.07%
jan 1, 2010
1.184K
+17.667
1.52%
jan 1, 2011
1.194K
+10.25
0.87%
jan 1, 2012
1.214K
+19.583
1.64%
jan 1, 2013
1.235K
+21.577
1.78%
jan 1, 2014
1.283K
+48.385
3.92%
jan 1, 2015
1.303K
+19.231
1.5%
Ranking of countries by current statistics by years