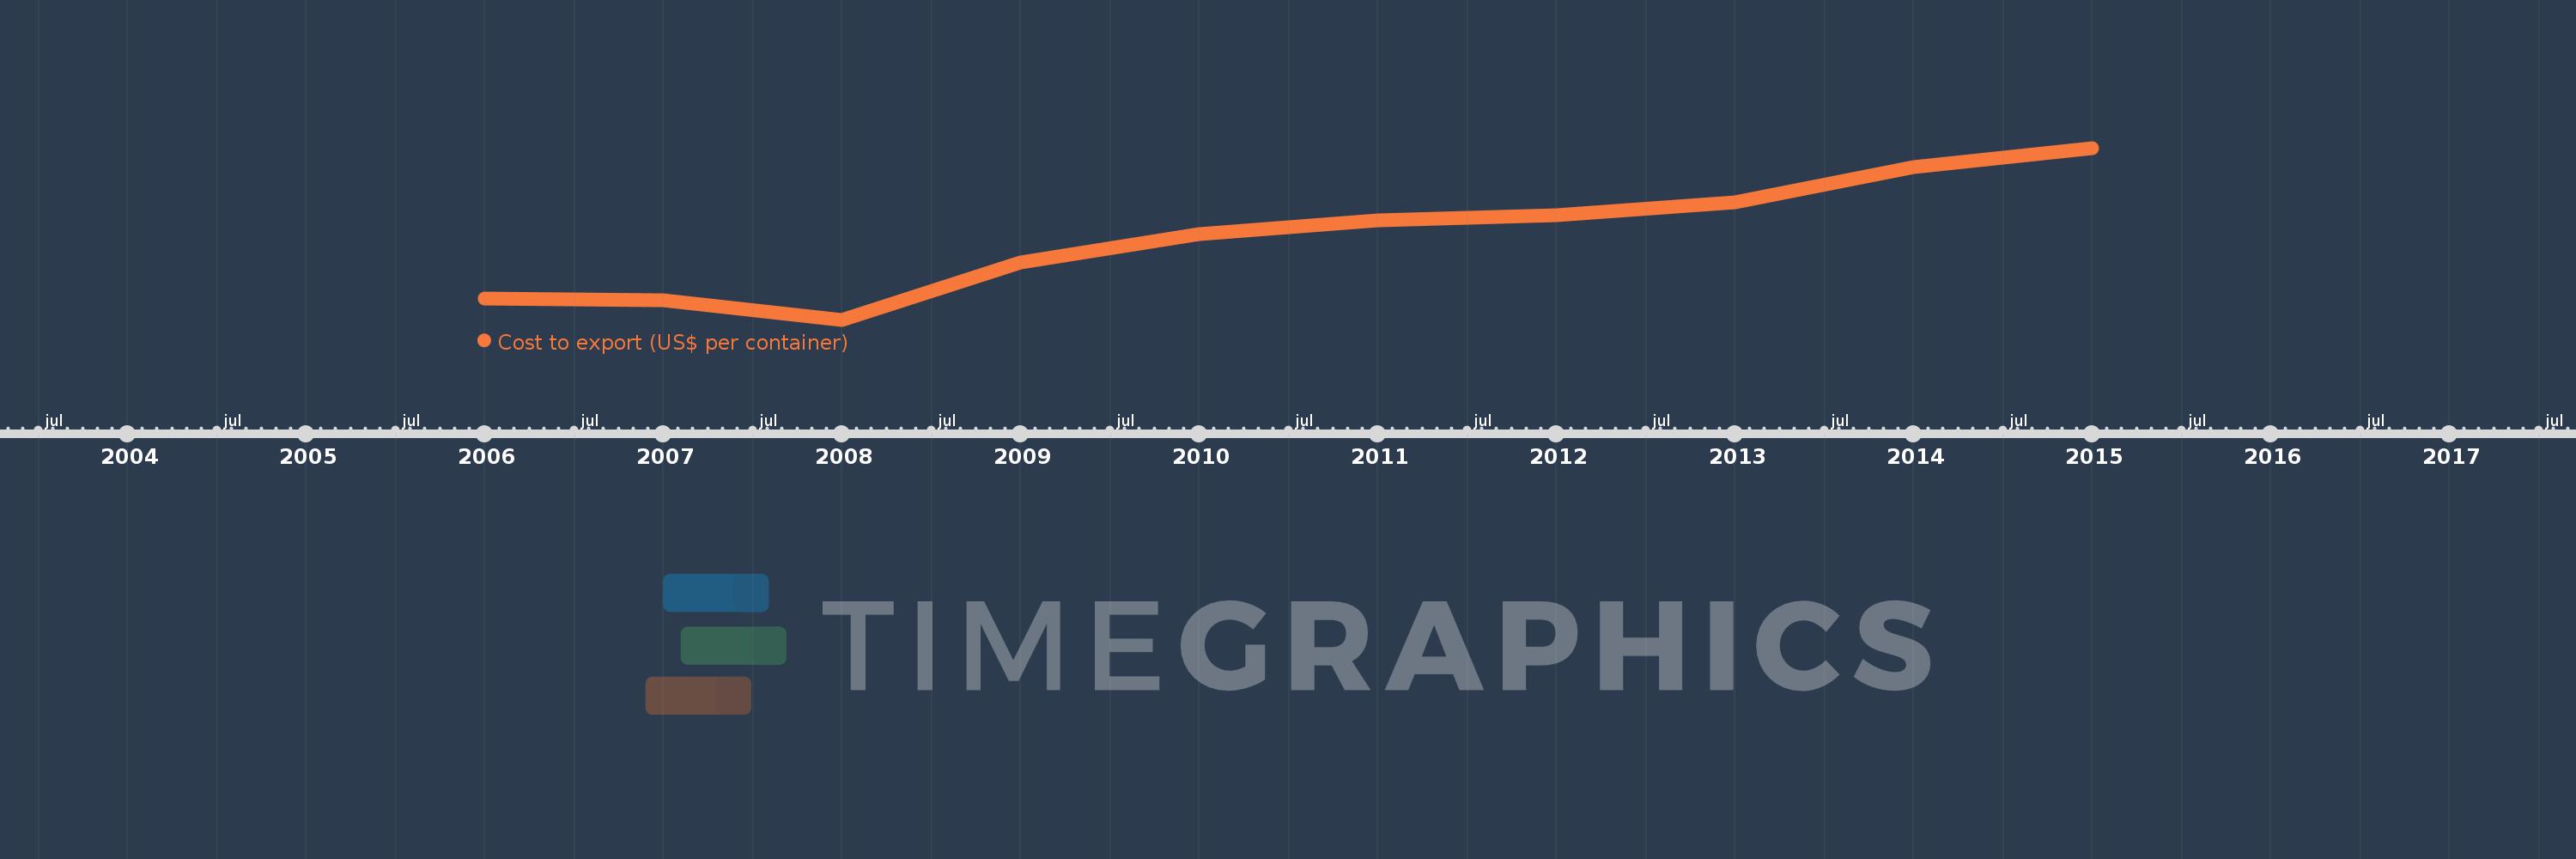
This timeline shows a graph from 2006 to 2015 of Fragile and conflict affected situations. No data until 2005. Number of actual observations by date: 10.
Source name:
World Development Indicators
Source organization:
World Bank, Doing Business project (http://www.doingbusiness.org/).
Categories, topics:
Private Sector, Trade
Last updated:
apr 23, 2017
Indicators value changes by year
Meaning:
1.861K
Minimum:
1.63K
jan 1, 2008
Maximum:
2.109K
jan 1, 2015
At the date of observation
Value
Absolute change
Change from the previous value
jan 1, 2006
1.688K
+1.688K
0.0%
jan 1, 2007
1.683K
-5.075
-0.3%
jan 1, 2008
1.63K
-53.517
-3.18%
jan 1, 2009
1.789K
+159.414
9.78%
jan 1, 2010
1.869K
+80.167
4.48%
jan 1, 2011
1.906K
+36.867
1.97%
jan 1, 2012
1.921K
+14.533
0.76%
jan 1, 2013
1.958K
+37.767
1.97%
jan 1, 2014
2.056K
+97.939
5.0%
jan 1, 2015
2.109K
+52.606
2.56%
Ranking of countries by current statistics by years