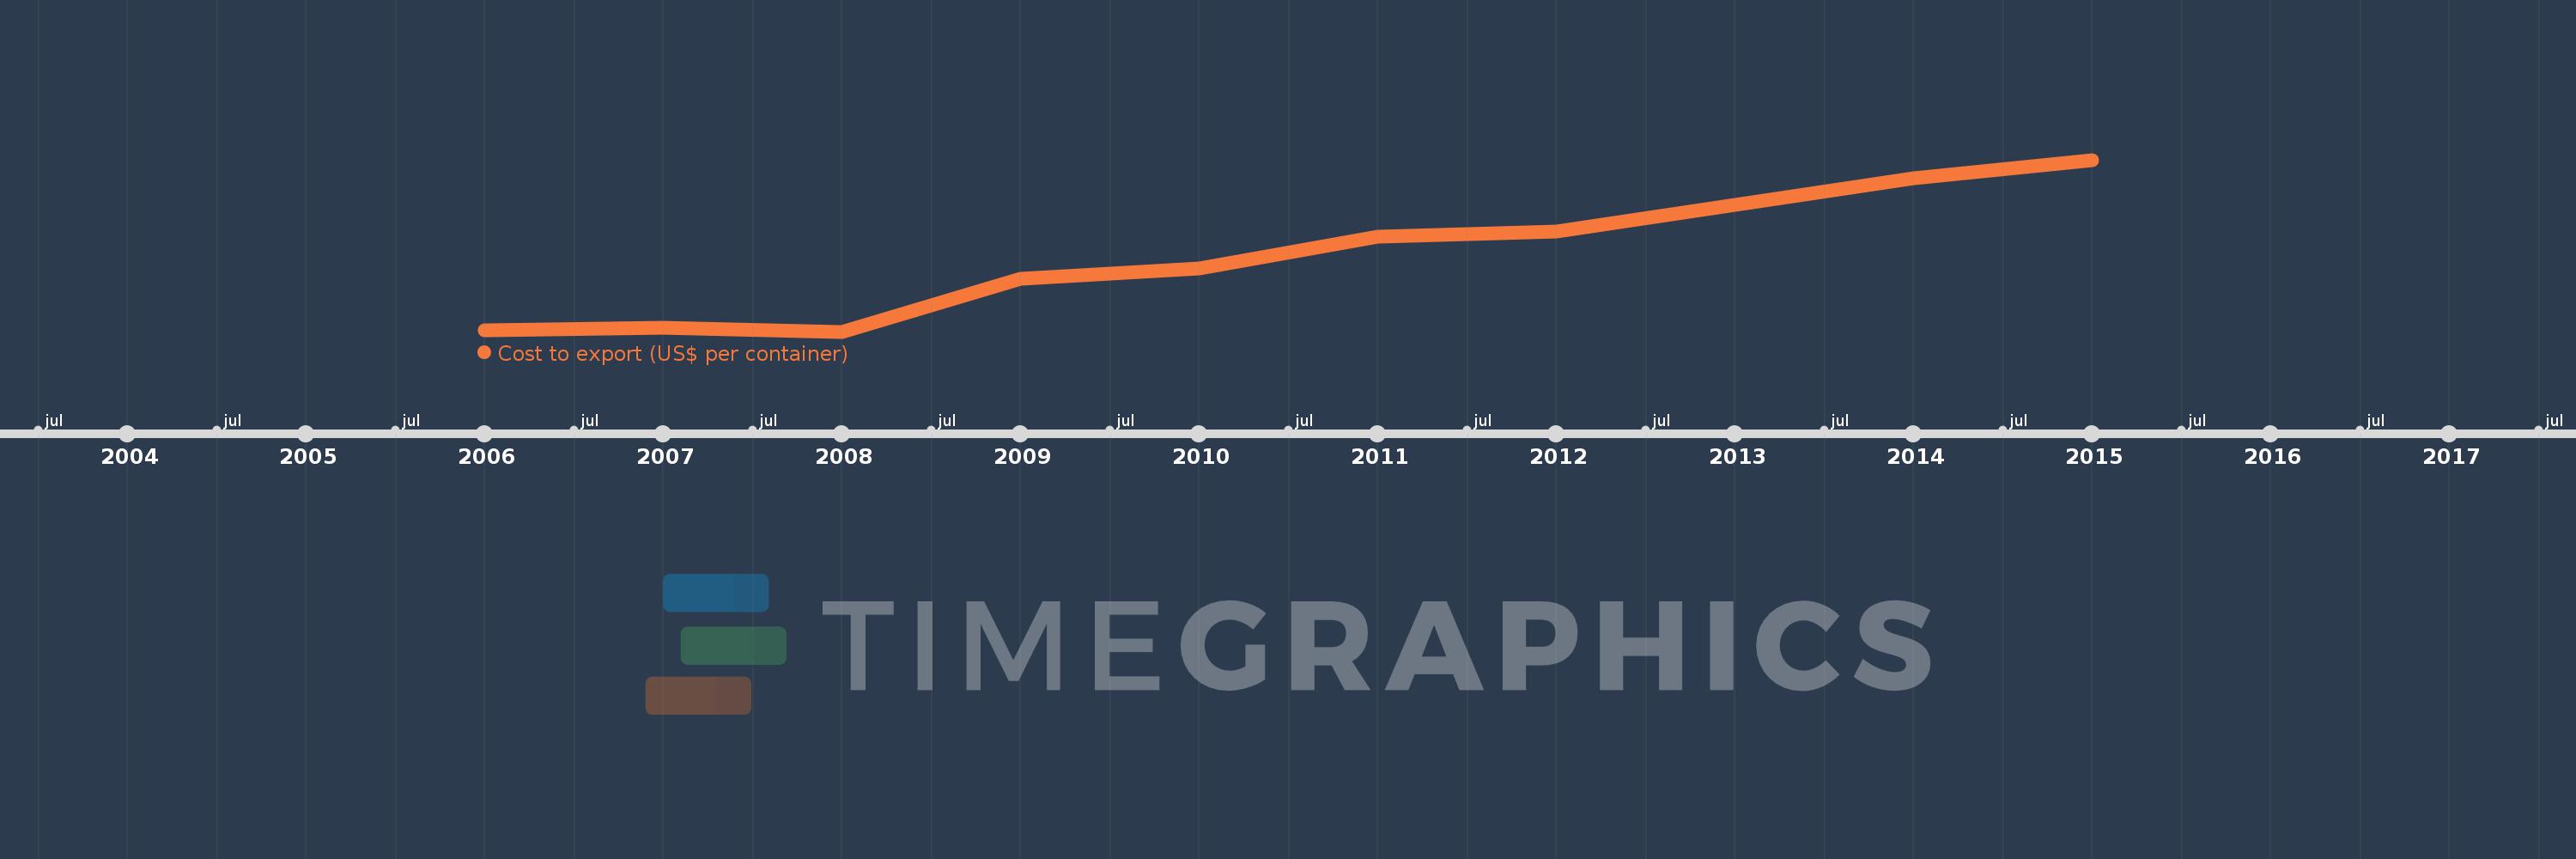
This timeline shows a graph from 2006 to 2015 of Least developed countries: UN classification. No data until 2005. Number of actual observations by date: 10.
Source name:
World Development Indicators
Source organization:
World Bank, Doing Business project (http://www.doingbusiness.org/).
Categories, topics:
Private Sector, Trade
Last updated:
apr 23, 2017
Indicators value changes by year
Meaning:
1.817K
Minimum:
1.601K
jan 1, 2008
Maximum:
2.084K
jan 1, 2015
At the date of observation
Value
Absolute change
Change from the previous value
jan 1, 2006
1.606K
+1.606K
0.0%
jan 1, 2007
1.613K
+7.076
0.44%
jan 1, 2008
1.601K
-11.893
-0.74%
jan 1, 2009
1.749K
+147.855
9.24%
jan 1, 2010
1.779K
+30.25
1.73%
jan 1, 2011
1.868K
+89.539
5.03%
jan 1, 2012
1.883K
+14.093
0.75%
jan 1, 2013
1.958K
+75.863
4.03%
jan 1, 2014
2.032K
+74.033
3.78%
jan 1, 2015
2.084K
+51.913
2.55%
Ranking of countries by current statistics by years