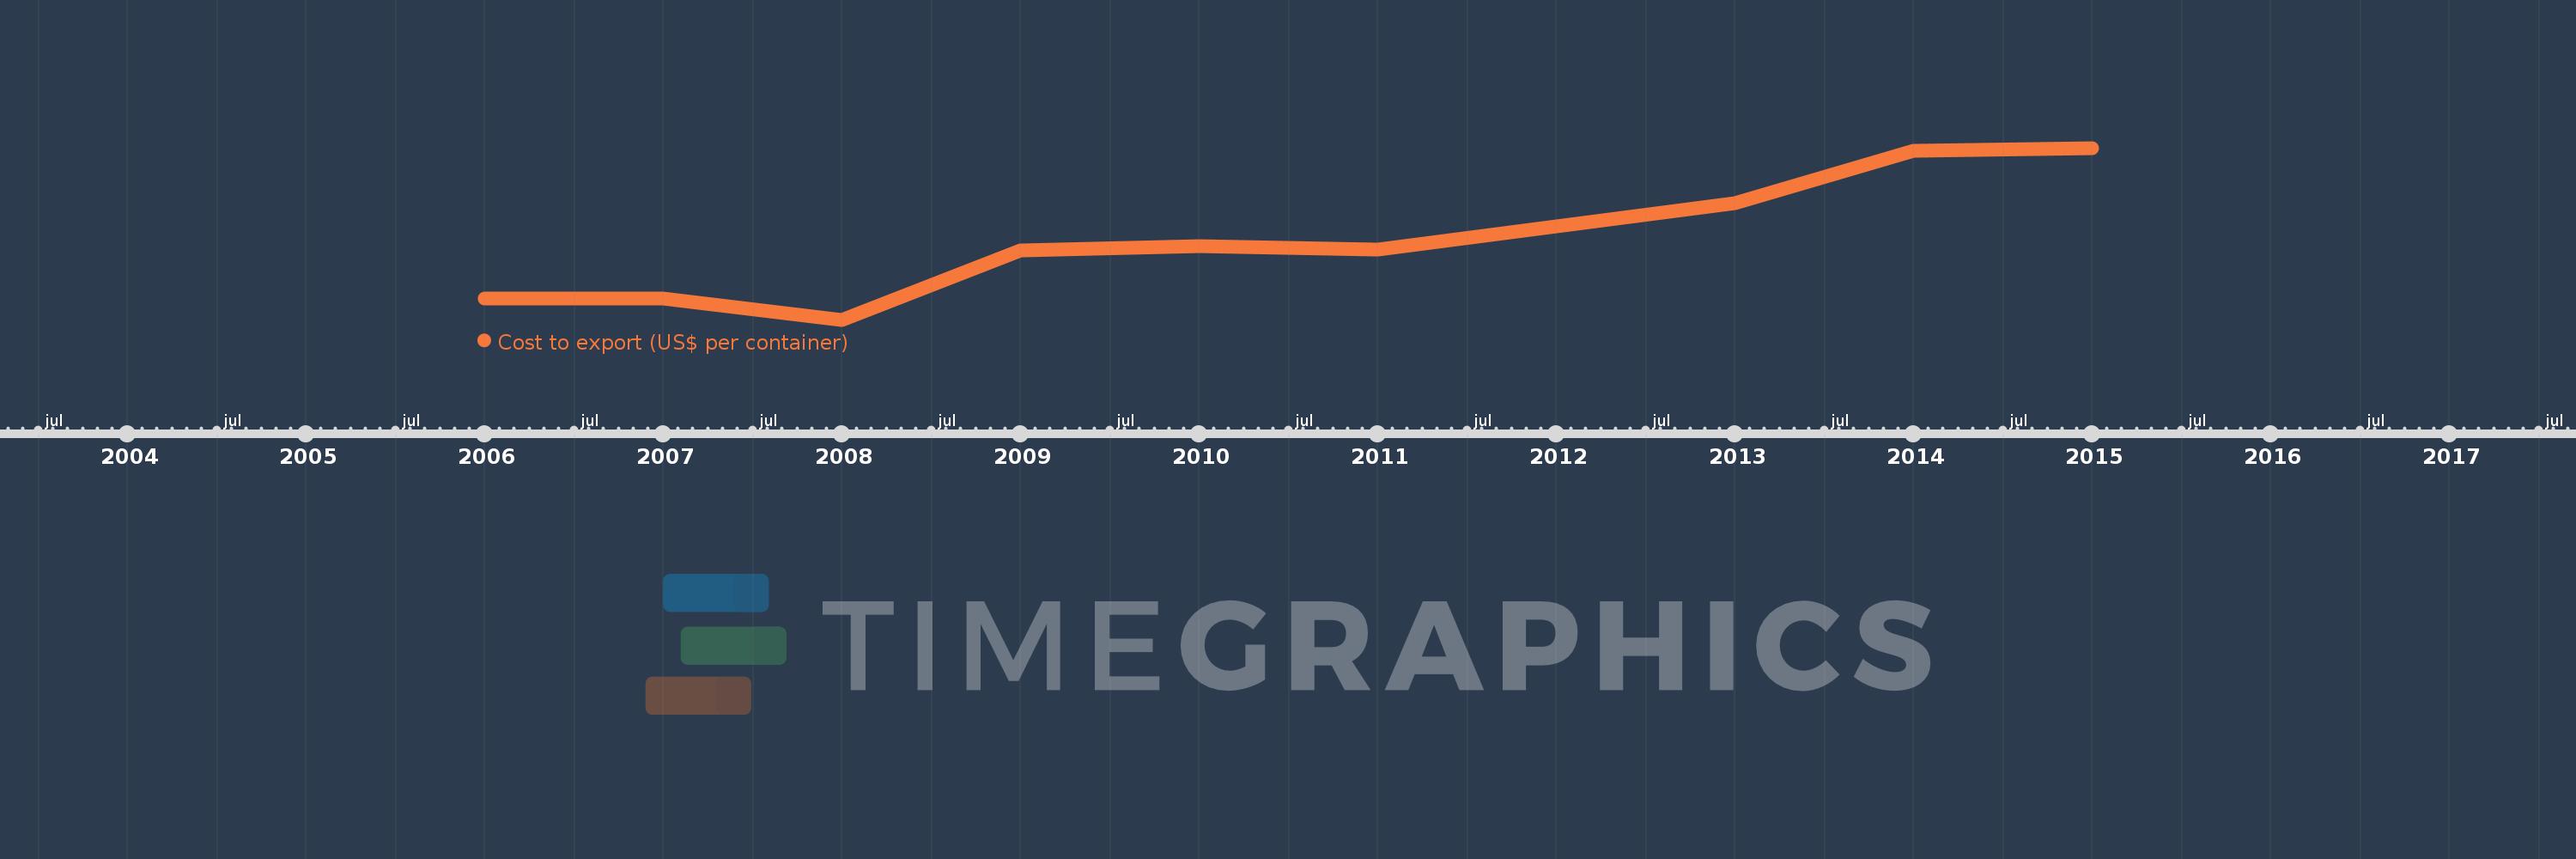
This timeline shows a graph from 2006 to 2015 of Latin America & the Caribbean (IDA & IBRD countries). No data until 2005. Number of actual observations by date: 10.
Source name:
World Development Indicators
Source organization:
World Bank, Doing Business project (http://www.doingbusiness.org/).
Categories, topics:
Private Sector, Trade
Last updated:
apr 23, 2017
Indicators value changes by year
Meaning:
1.138K
Minimum:
983.633
jan 1, 2008
Maximum:
1.312K
jan 1, 2015
At the date of observation
Value
Absolute change
Change from the previous value
jan 1, 2006
1.024K
+1.024K
0.0%
jan 1, 2007
1.024K
+0.033
0.0%
jan 1, 2008
983.633
-40.267
-3.93%
jan 1, 2009
1.117K
+133.153
13.54%
jan 1, 2010
1.124K
+7.587
0.68%
jan 1, 2011
1.118K
-6.203
-0.55%
jan 1, 2012
1.162K
+44.307
3.96%
jan 1, 2013
1.207K
+44.733
3.85%
jan 1, 2014
1.307K
+100.177
8.3%
jan 1, 2015
1.312K
+4.783
0.37%
Ranking of countries by current statistics by years