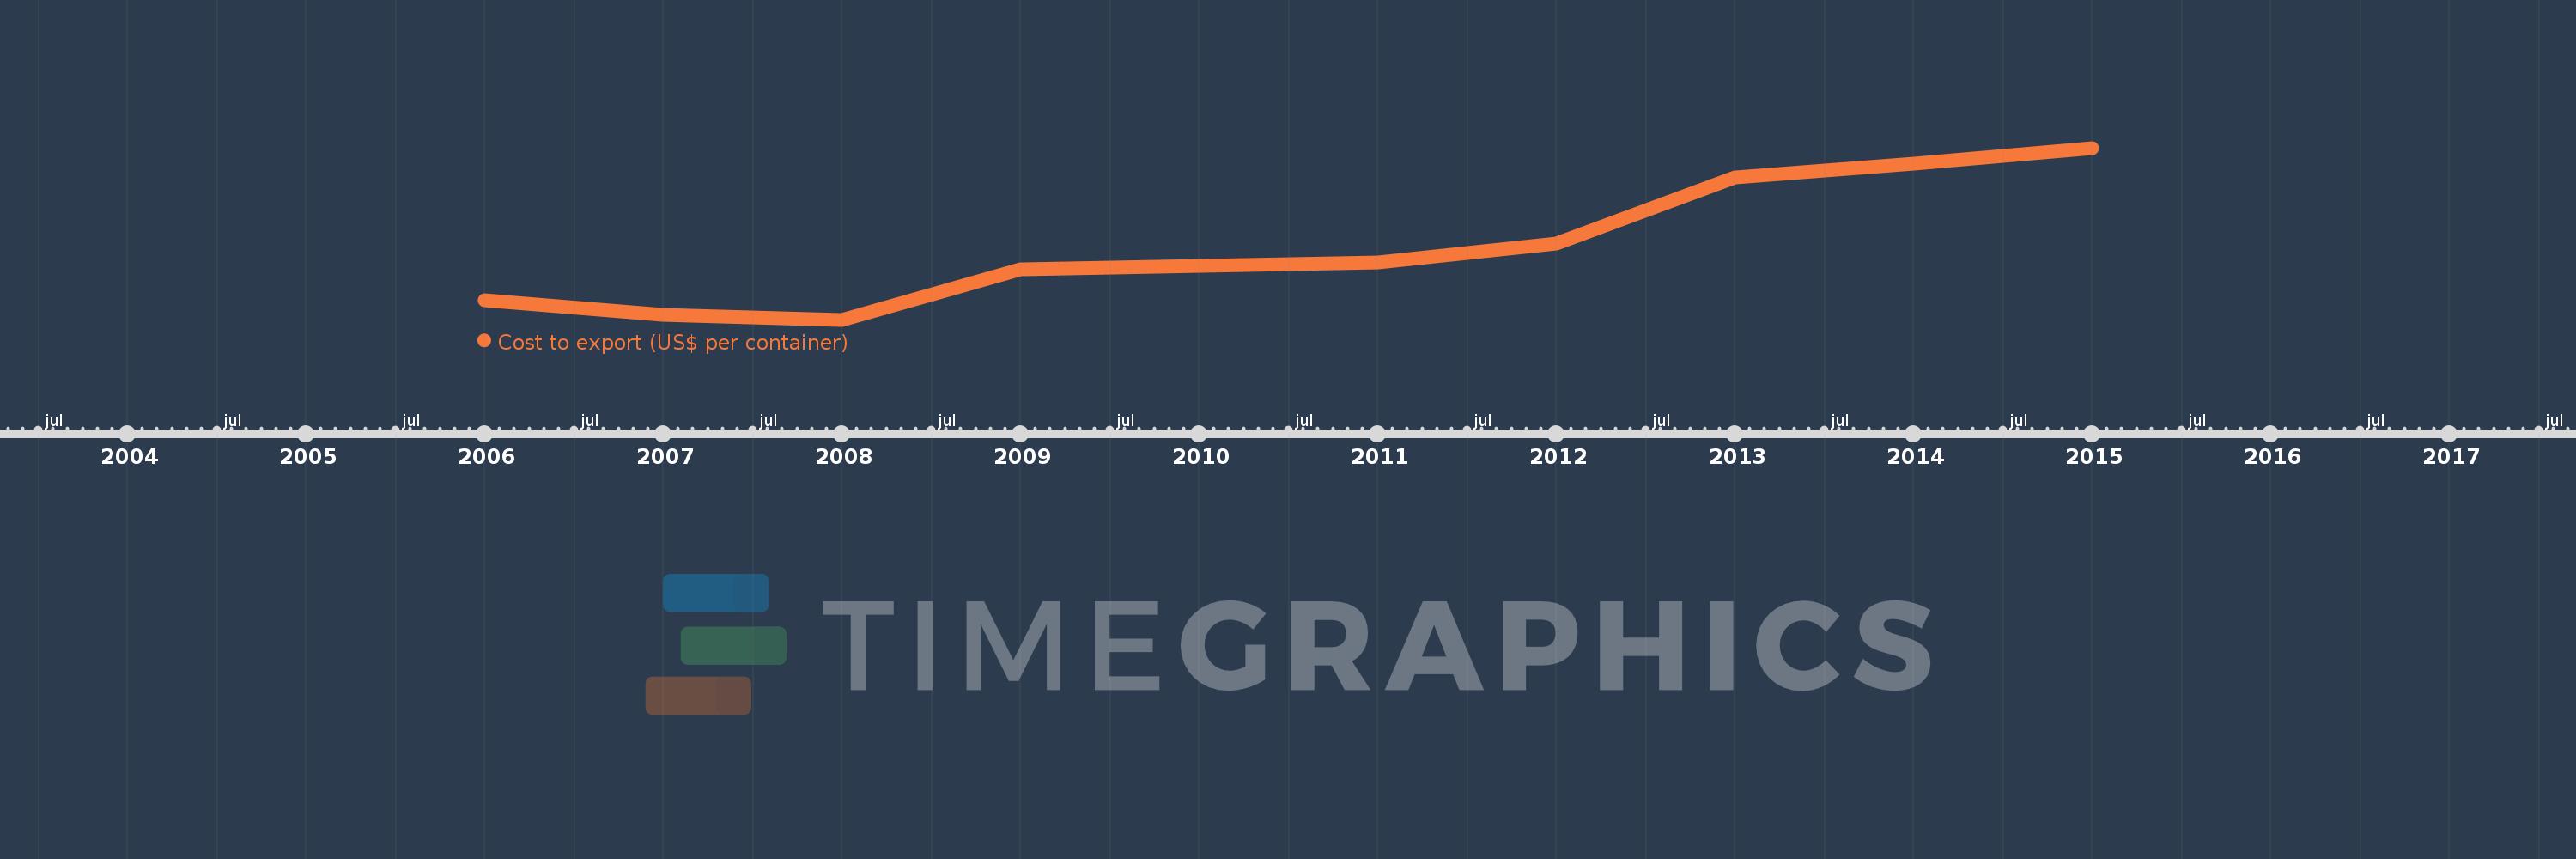
This timeline shows a graph from 2006 to 2015 of Europe & Central Asia (IDA & IBRD countries). No data until 2005. Number of actual observations by date: 10.
Source name:
World Development Indicators
Source organization:
World Bank, Doing Business project (http://www.doingbusiness.org/).
Categories, topics:
Private Sector, Trade
Last updated:
apr 23, 2017
Indicators value changes by year
Meaning:
1.928K
Minimum:
1.602K
jan 1, 2008
Maximum:
2.367K
jan 1, 2015
At the date of observation
Value
Absolute change
Change from the previous value
jan 1, 2006
1.69K
+1.69K
0.0%
jan 1, 2007
1.624K
-65.22
-3.86%
jan 1, 2008
1.602K
-22.262
-1.37%
jan 1, 2009
1.826K
+223.952
13.98%
jan 1, 2010
1.841K
+14.996
0.82%
jan 1, 2011
1.856K
+15.182
0.82%
jan 1, 2012
1.94K
+84.045
4.53%
jan 1, 2013
2.236K
+295.295
15.22%
jan 1, 2014
2.298K
+62.727
2.81%
jan 1, 2015
2.367K
+68.318
2.97%
Ranking of countries by current statistics by years