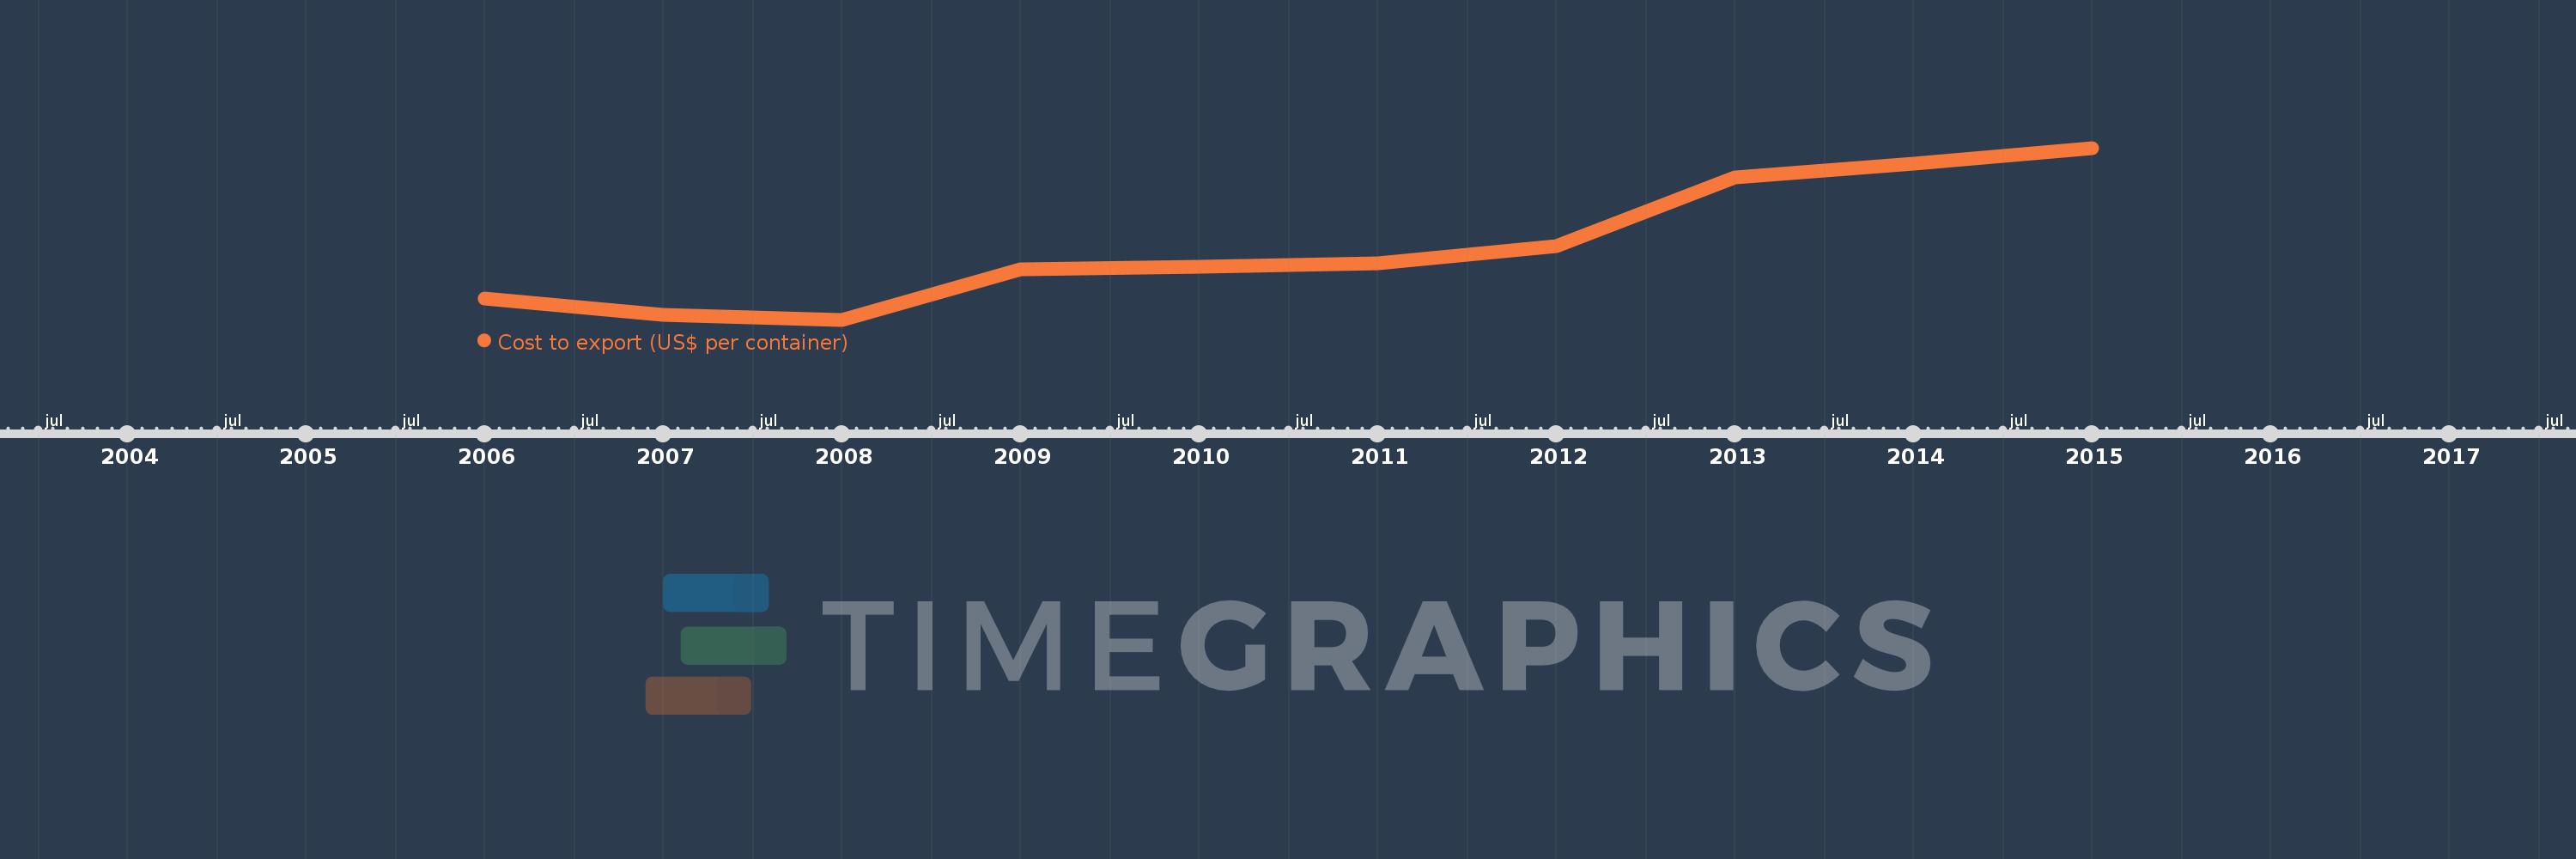
This timeline shows a graph from 2006 to 2015 of Europe & Central Asia (excluding high income). No data until 2005. Number of actual observations by date: 10.
Source name:
World Development Indicators
Source organization:
World Bank, Doing Business project (http://www.doingbusiness.org/).
Categories, topics:
Private Sector, Trade
Last updated:
apr 23, 2017
Indicators value changes by year
Meaning:
2.012K
Minimum:
1.664K
jan 1, 2008
Maximum:
2.484K
jan 1, 2015
At the date of observation
Value
Absolute change
Change from the previous value
jan 1, 2006
1.764K
+1.764K
0.0%
jan 1, 2007
1.688K
-76.019
-4.31%
jan 1, 2008
1.664K
-24.605
-1.46%
jan 1, 2009
1.904K
+240.632
14.46%
jan 1, 2010
1.917K
+12.582
0.66%
jan 1, 2011
1.934K
+16.7
0.87%
jan 1, 2012
2.017K
+83.2
4.3%
jan 1, 2013
2.342K
+324.825
16.11%
jan 1, 2014
2.409K
+67.25
2.87%
jan 1, 2015
2.484K
+75.15
3.12%
Ranking of countries by current statistics by years