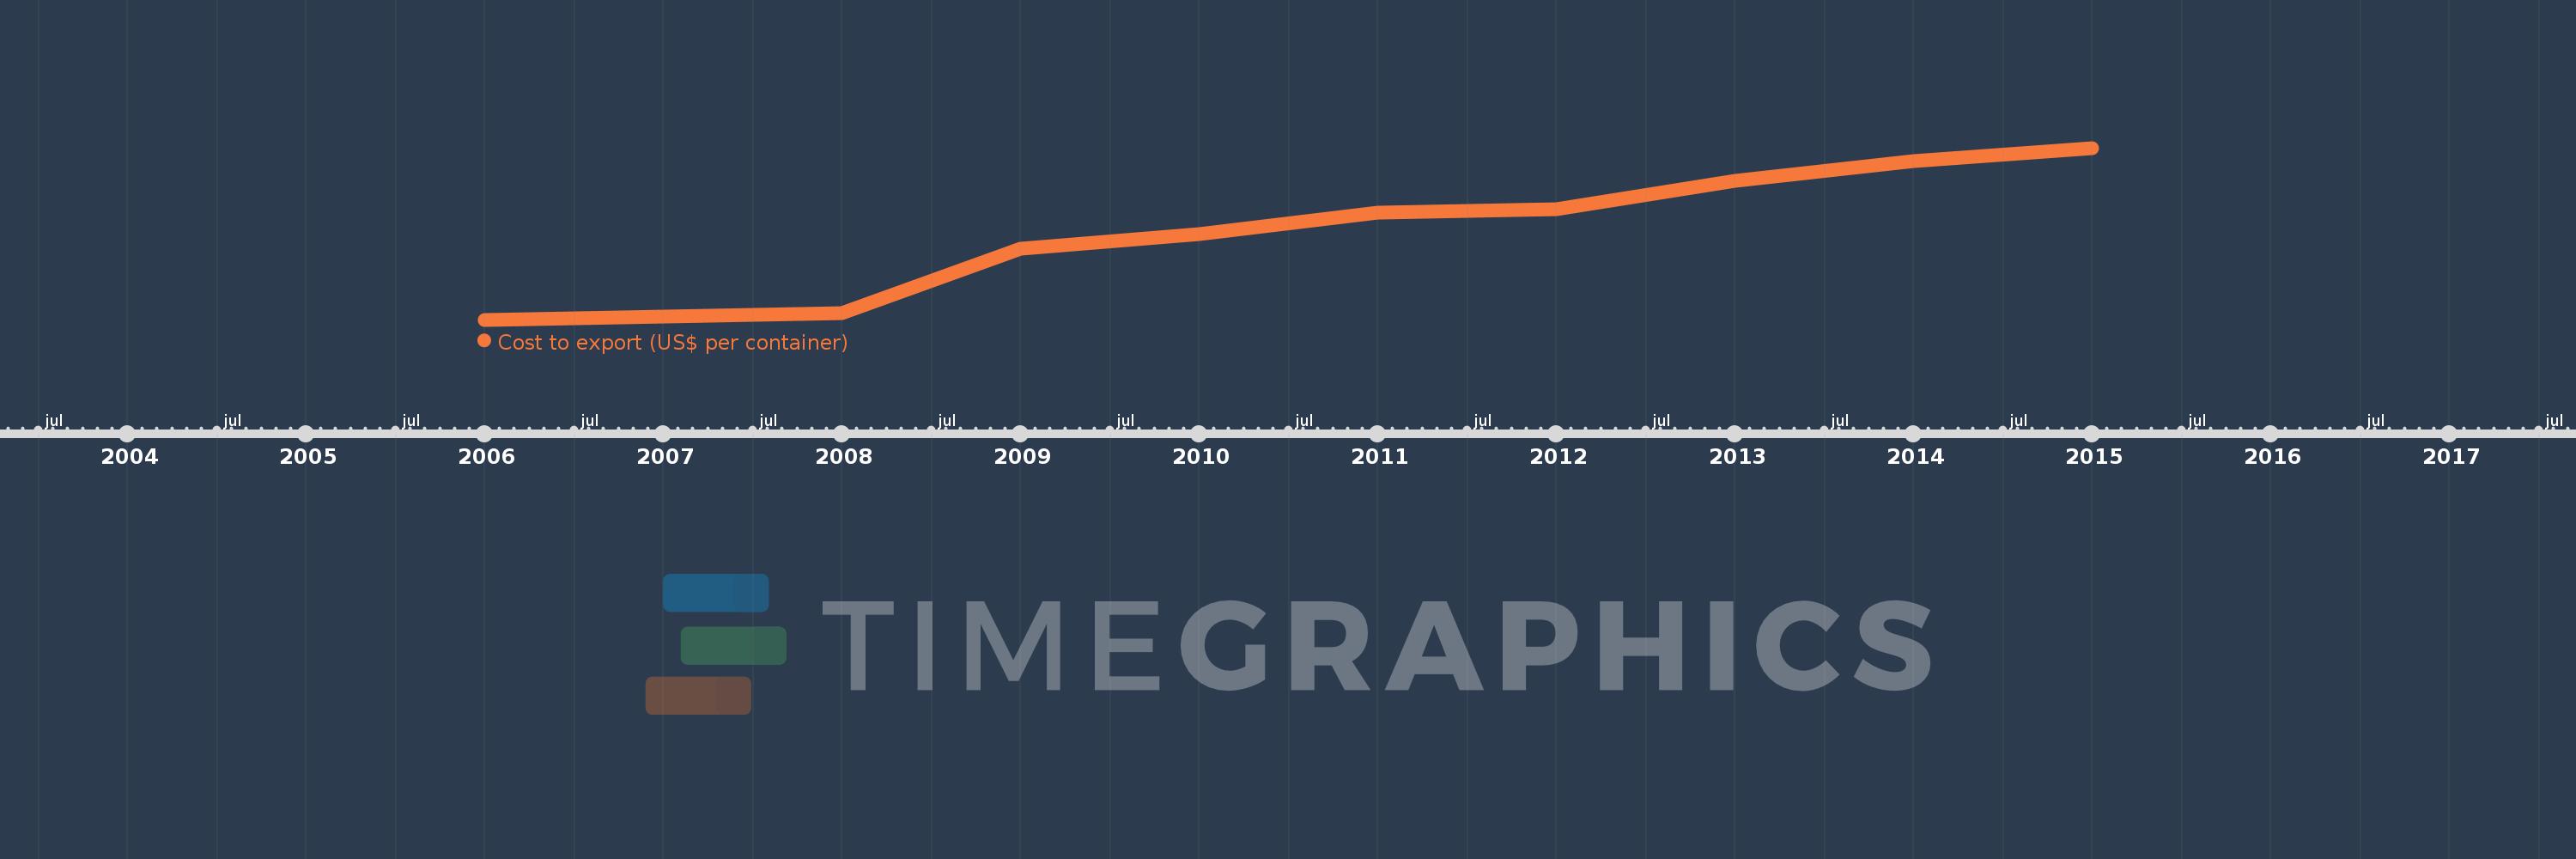
This timeline shows a graph from 2006 to 2015 of Sub-Saharan Africa (excluding high income). No data until 2005. Number of actual observations by date: 10.
Source name:
World Development Indicators
Source organization:
World Bank, Doing Business project (http://www.doingbusiness.org/).
Categories, topics:
Private Sector, Trade
Last updated:
apr 23, 2017
Indicators value changes by year
Meaning:
1.937K
Minimum:
1.644K
jan 1, 2006
Maximum:
2.233K
jan 1, 2015
At the date of observation
Value
Absolute change
Change from the previous value
jan 1, 2006
1.644K
+1.644K
0.0%
jan 1, 2007
1.654K
+9.723
0.59%
jan 1, 2008
1.668K
+14.289
0.86%
jan 1, 2009
1.888K
+219.907
13.18%
jan 1, 2010
1.938K
+50.527
2.68%
jan 1, 2011
2.011K
+72.356
3.73%
jan 1, 2012
2.023K
+12.622
0.63%
jan 1, 2013
2.12K
+96.276
4.76%
jan 1, 2014
2.187K
+67.574
3.19%
jan 1, 2015
2.233K
+45.978
2.1%
Ranking of countries by current statistics by years