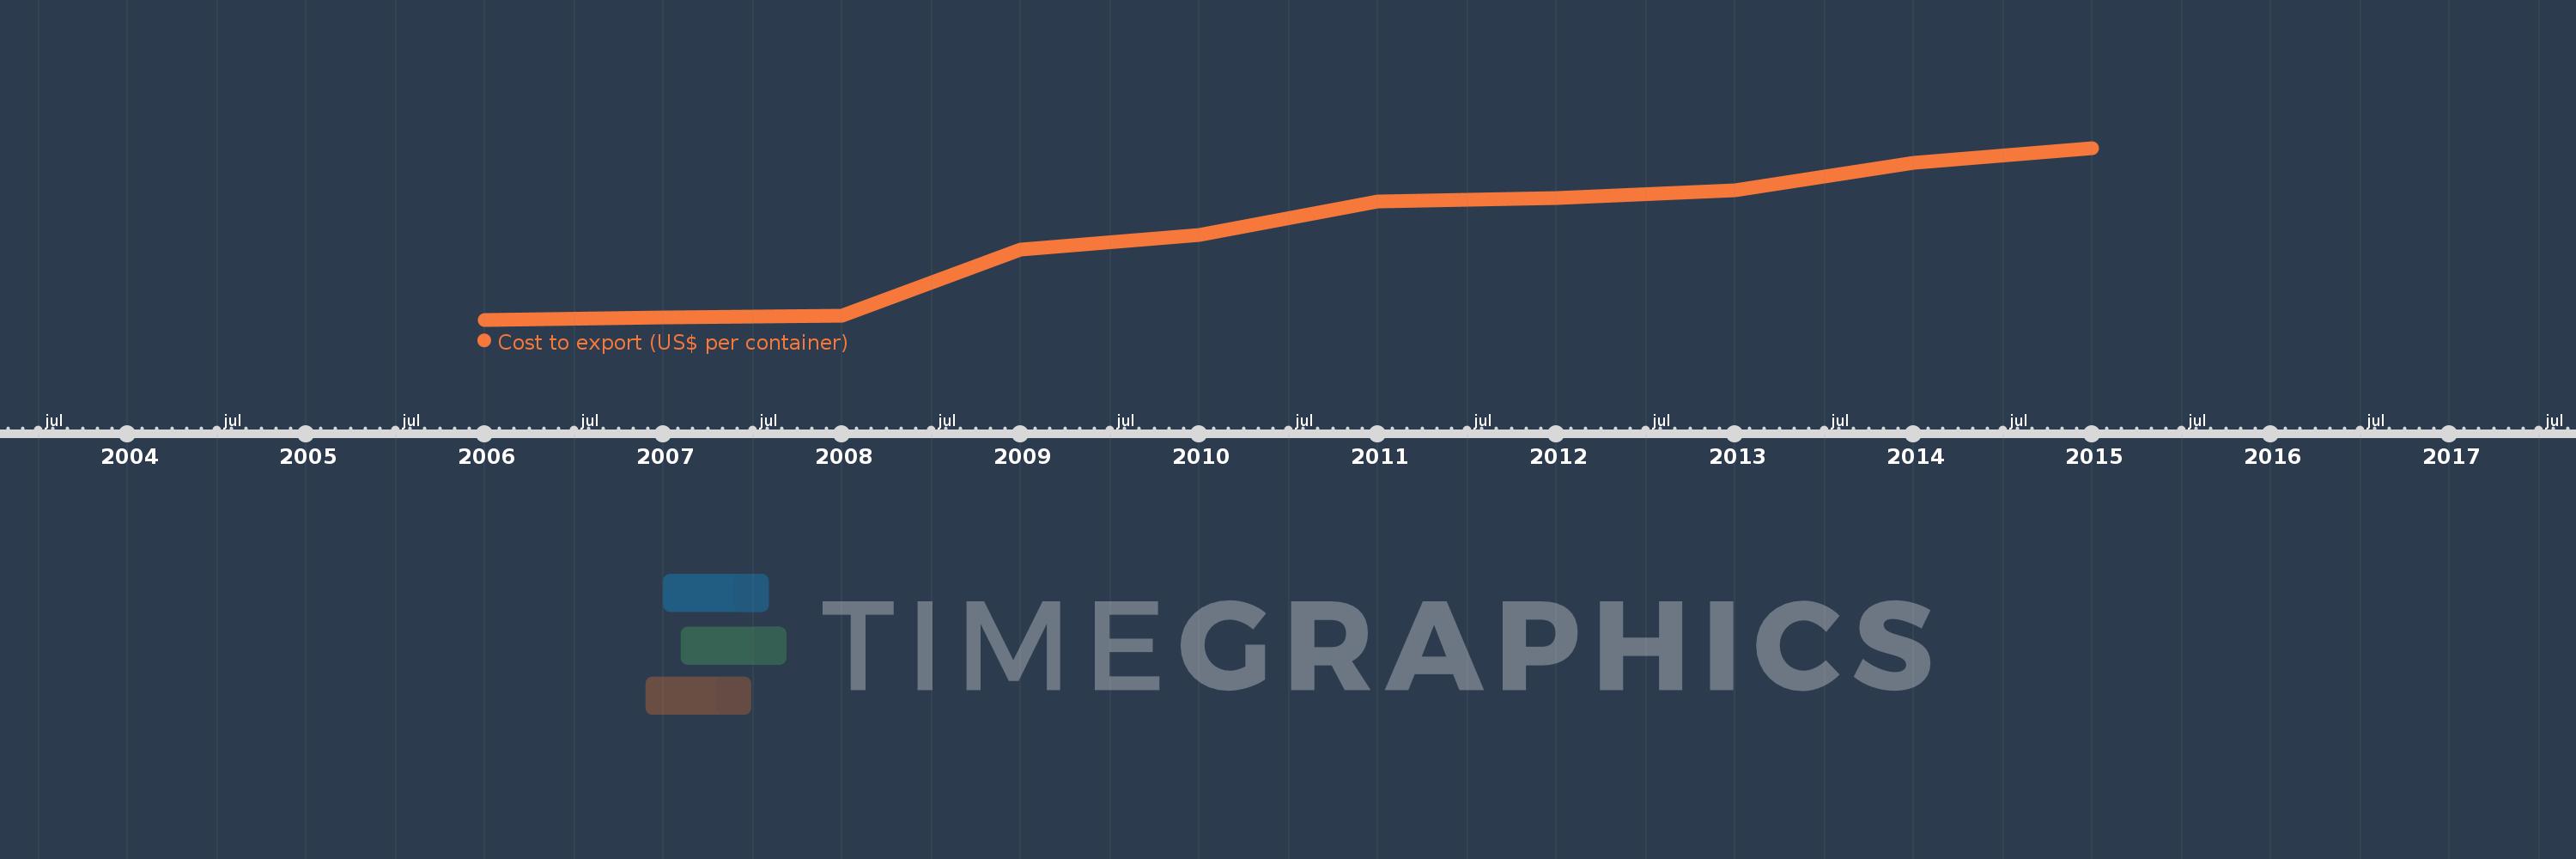
This timeline shows a graph from 2006 to 2015 of Heavily indebted poor countries (HIPC). No data until 2005. Number of actual observations by date: 10.
Source name:
World Development Indicators
Source organization:
World Bank, Doing Business project (http://www.doingbusiness.org/).
Categories, topics:
Private Sector, Trade
Last updated:
apr 23, 2017
Indicators value changes by year
Meaning:
1.92K
Minimum:
1.668K
jan 1, 2006
Maximum:
2.172K
jan 1, 2015
At the date of observation
Value
Absolute change
Change from the previous value
jan 1, 2006
1.668K
+1.668K
0.0%
jan 1, 2007
1.675K
+6.951
0.42%
jan 1, 2008
1.681K
+5.737
0.34%
jan 1, 2009
1.875K
+194.289
11.56%
jan 1, 2010
1.916K
+41.632
2.22%
jan 1, 2011
2.014K
+97.368
5.08%
jan 1, 2012
2.025K
+10.711
0.53%
jan 1, 2013
2.048K
+23.579
1.16%
jan 1, 2014
2.127K
+78.816
3.85%
jan 1, 2015
2.172K
+44.605
2.1%
Ranking of countries by current statistics by years