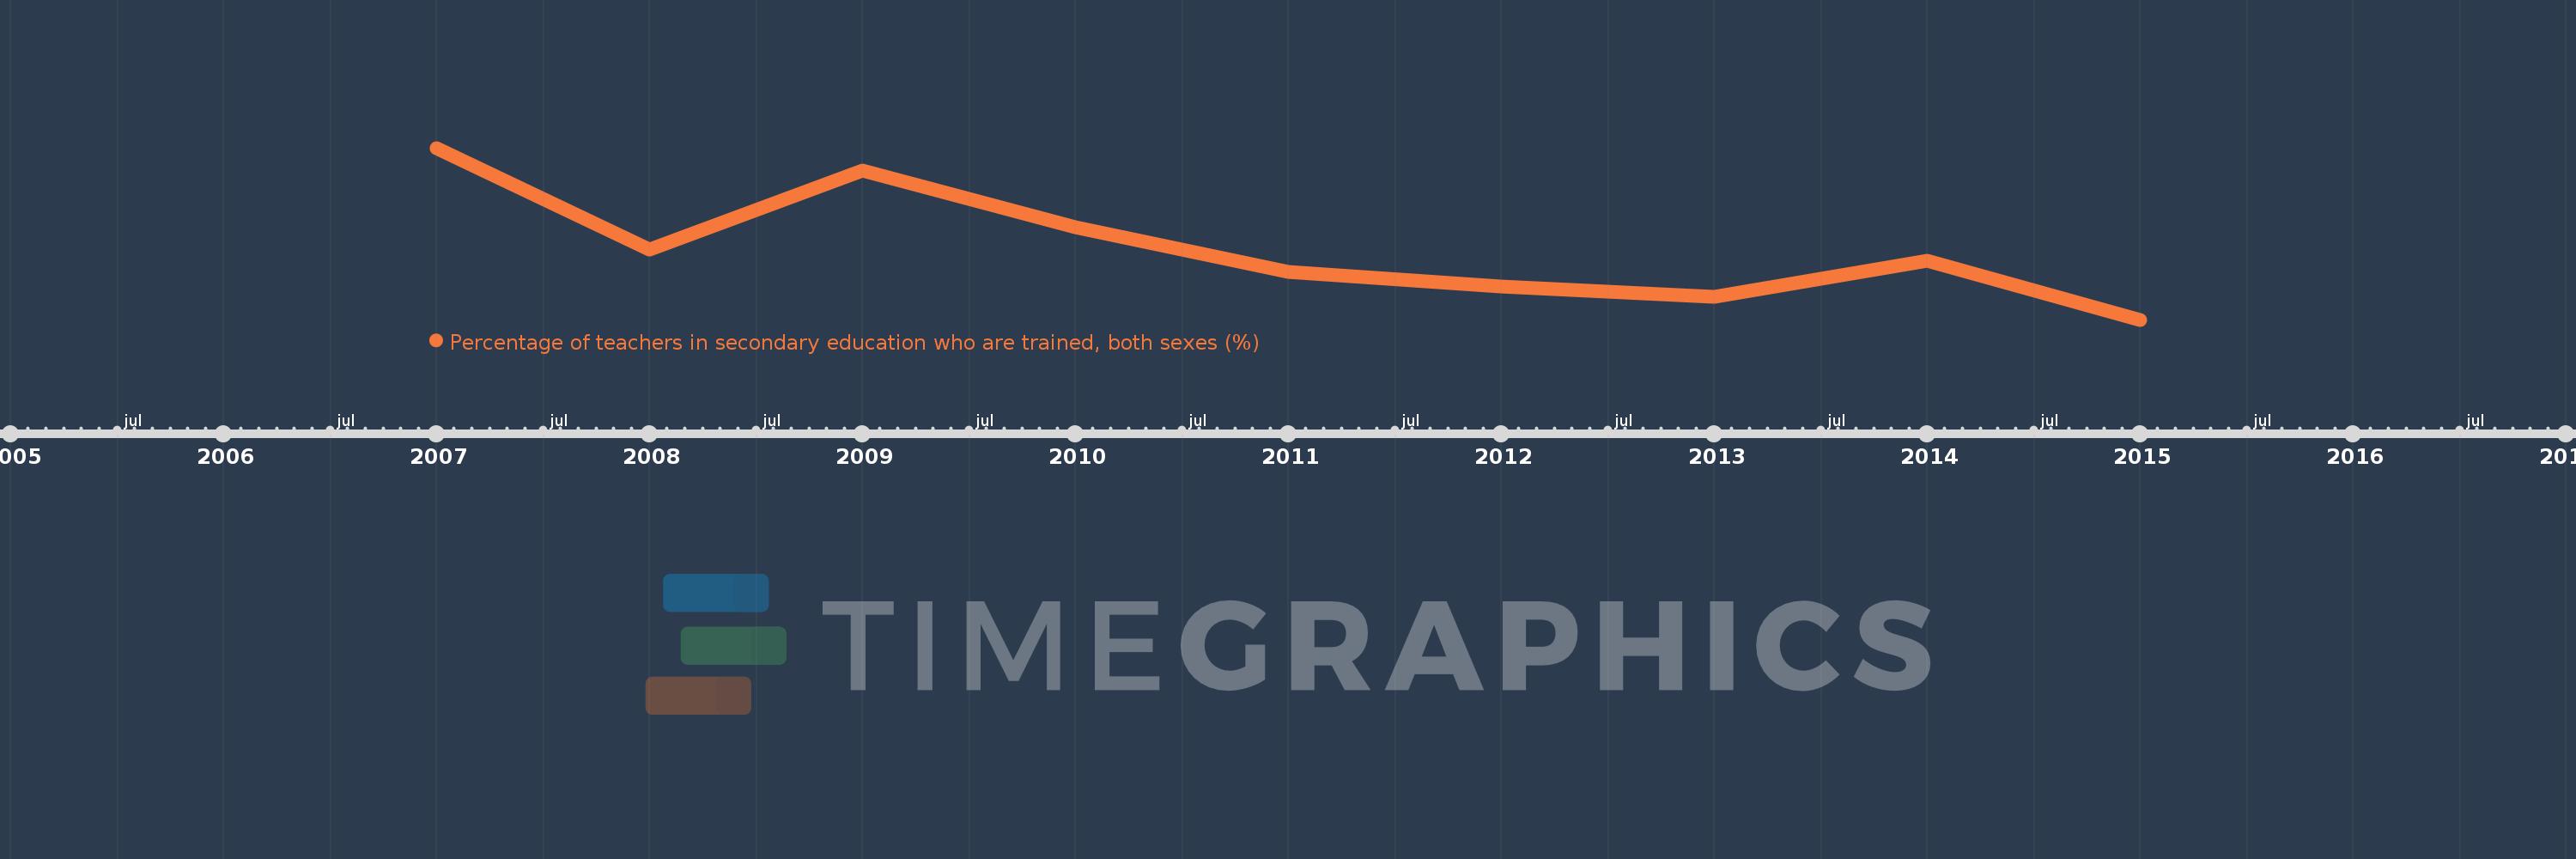
This timeline shows a graph from 2007 to 2015 of Sub-Saharan Africa (excluding high income). No data until 2006. Number of actual observations by date: 9.
Source name:
World Development Indicators
Source organization:
UNESCO Institute for Statistics
Categories, topics:
Education
Last updated:
apr 23, 2017
Indicators value changes by year
Meaning:
61.913
Minimum:
55.235
jan 1, 2015
Maximum:
71.215
jan 1, 2007
At the date of observation
Value
Absolute change
Change from the previous value
jan 1, 2007
71.215
+71.215
0.0%
jan 1, 2008
61.794
-9.421
-13.23%
jan 1, 2009
69.111
+7.317
11.84%
jan 1, 2010
63.814
-5.297
-7.66%
jan 1, 2011
59.67
-4.144
-6.49%
jan 1, 2012
58.322
-1.348
-2.26%
jan 1, 2013
57.346
-0.976
-1.67%
jan 1, 2014
60.71
+3.364
5.87%
jan 1, 2015
55.235
-5.475
-9.02%
Ranking of countries by current statistics by years