30
/
AIzaSyAYiBZKx7MnpbEhh9jyipgxe19OcubqV5w
April 1, 2024
168929
Kiribati
KIR
true
2
1
Percentage of teachers in secondary education who are trained, both sexes (%)
2009,2008,2007,2006
Download
Global statistics library →Kiribati →

Percentage of teachers in secondary education who are trained, both sexes (%)

This statistics in other country:

AndorraAntigua and BarbudaArab WorldArubaBahamas, TheBahrainBangladeshBarbadosBelarusBelizeBeninBermudaBhutanBotswanaBritish Virgin IslandsBrunei DarussalamBurkina FasoBurundiCabo VerdeCambodiaCameroonCaribbean small statesCayman IslandsChadColombiaComorosCongo, Dem. Rep.Congo, Rep.Costa RicaCote d'IvoireCroatiaCubaDjiboutiDominicaDominican RepublicEcuadorEgypt, Arab Rep.El SalvadorEquatorial GuineaEritreaEthiopiaFijiFragile and conflict affected situationsGambia, TheGeorgiaGhanaGibraltarGrenadaGuineaGuyanaHeavily indebted poor countries (HIPC)HondurasHong Kong SAR, ChinaIDA blendIDA onlyIDA totalIran, Islamic Rep.IraqJamaicaKazakhstanKenyaKiribatiKuwaitKyrgyz RepublicLao PDRLatin America & Caribbean Latin America & Caribbean (excluding high income)Latin America & the Caribbean (IDA & IBRD countries)Least developed countries: UN classificationLebanonLesothoLiberiaLow incomeMacao SAR, ChinaMadagascarMalawiMalaysiaMaldivesMaliMauritaniaMauritiusMexicoMiddle East & North AfricaMiddle East & North Africa (excluding high income)Middle East & North Africa (IDA & IBRD countries)MongoliaMozambiqueMyanmarNamibiaNauruNepalNicaraguaNigerNigeriaOmanOther small statesPacific island small statesPanamaPapua New GuineaParaguayPeruPhilippinesPre-demographic dividendQatarRwandaSao Tome and PrincipeSaudi ArabiaSerbiaSeychellesSierra LeoneSingaporeSmall statesSolomon IslandsSri LankaSt. Kitts and NevisSt. LuciaSt. Vincent and the GrenadinesSub-Saharan Africa Sub-Saharan Africa (excluding high income)Sub-Saharan Africa (IDA & IBRD countries)SudanSurinameSwazilandSyrian Arab RepublicTajikistanTogoTongaTurks and Caicos IslandsUgandaUnited Arab EmiratesUzbekistanWest Bank and GazaZimbabwe

Timeline:

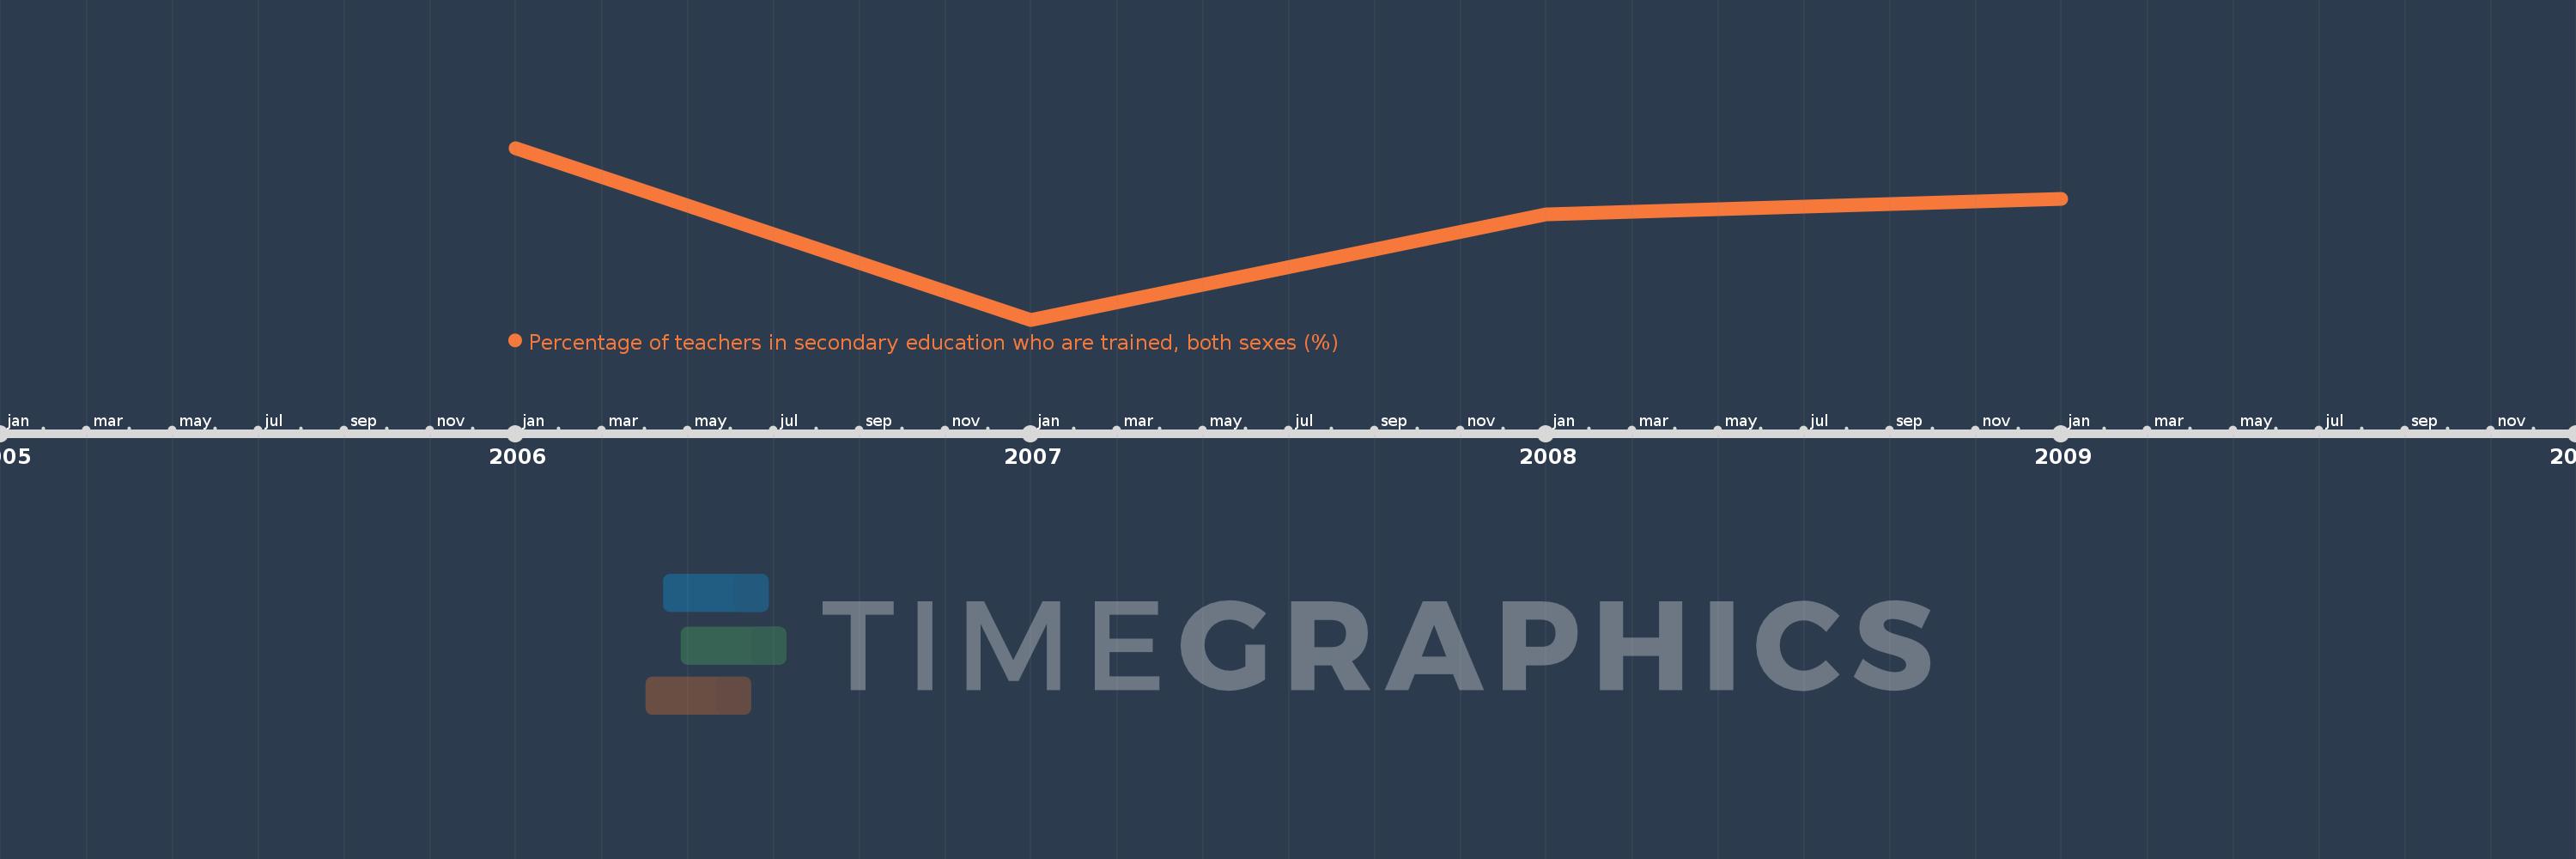
This timeline shows a graph from 2006 to 2009 of Kiribati. No data until 2005. Number of actual observations by date: 4.

Source name:

World Development Indicators

Source organization:

UNESCO Institute for Statistics

Categories, topics:

Education

Last updated:

apr 23, 2017

Indicators value changes by year

Meaning:
60.081
Minimum:
50.866
jan 1, 2007
Maximum:
66.765
jan 1, 2006
At the date of observation
Value
Absolute change
Change from the previous value
jan 1, 2006
66.765
+66.765
0.0%
jan 1, 2007
50.866
-15.899
-23.81%
jan 1, 2008
60.643
+9.777
19.22%
jan 1, 2009
62.048
+1.405
2.32%

Ranking of countries by current statistics by years