Download This statistics in other country:
Timeline:
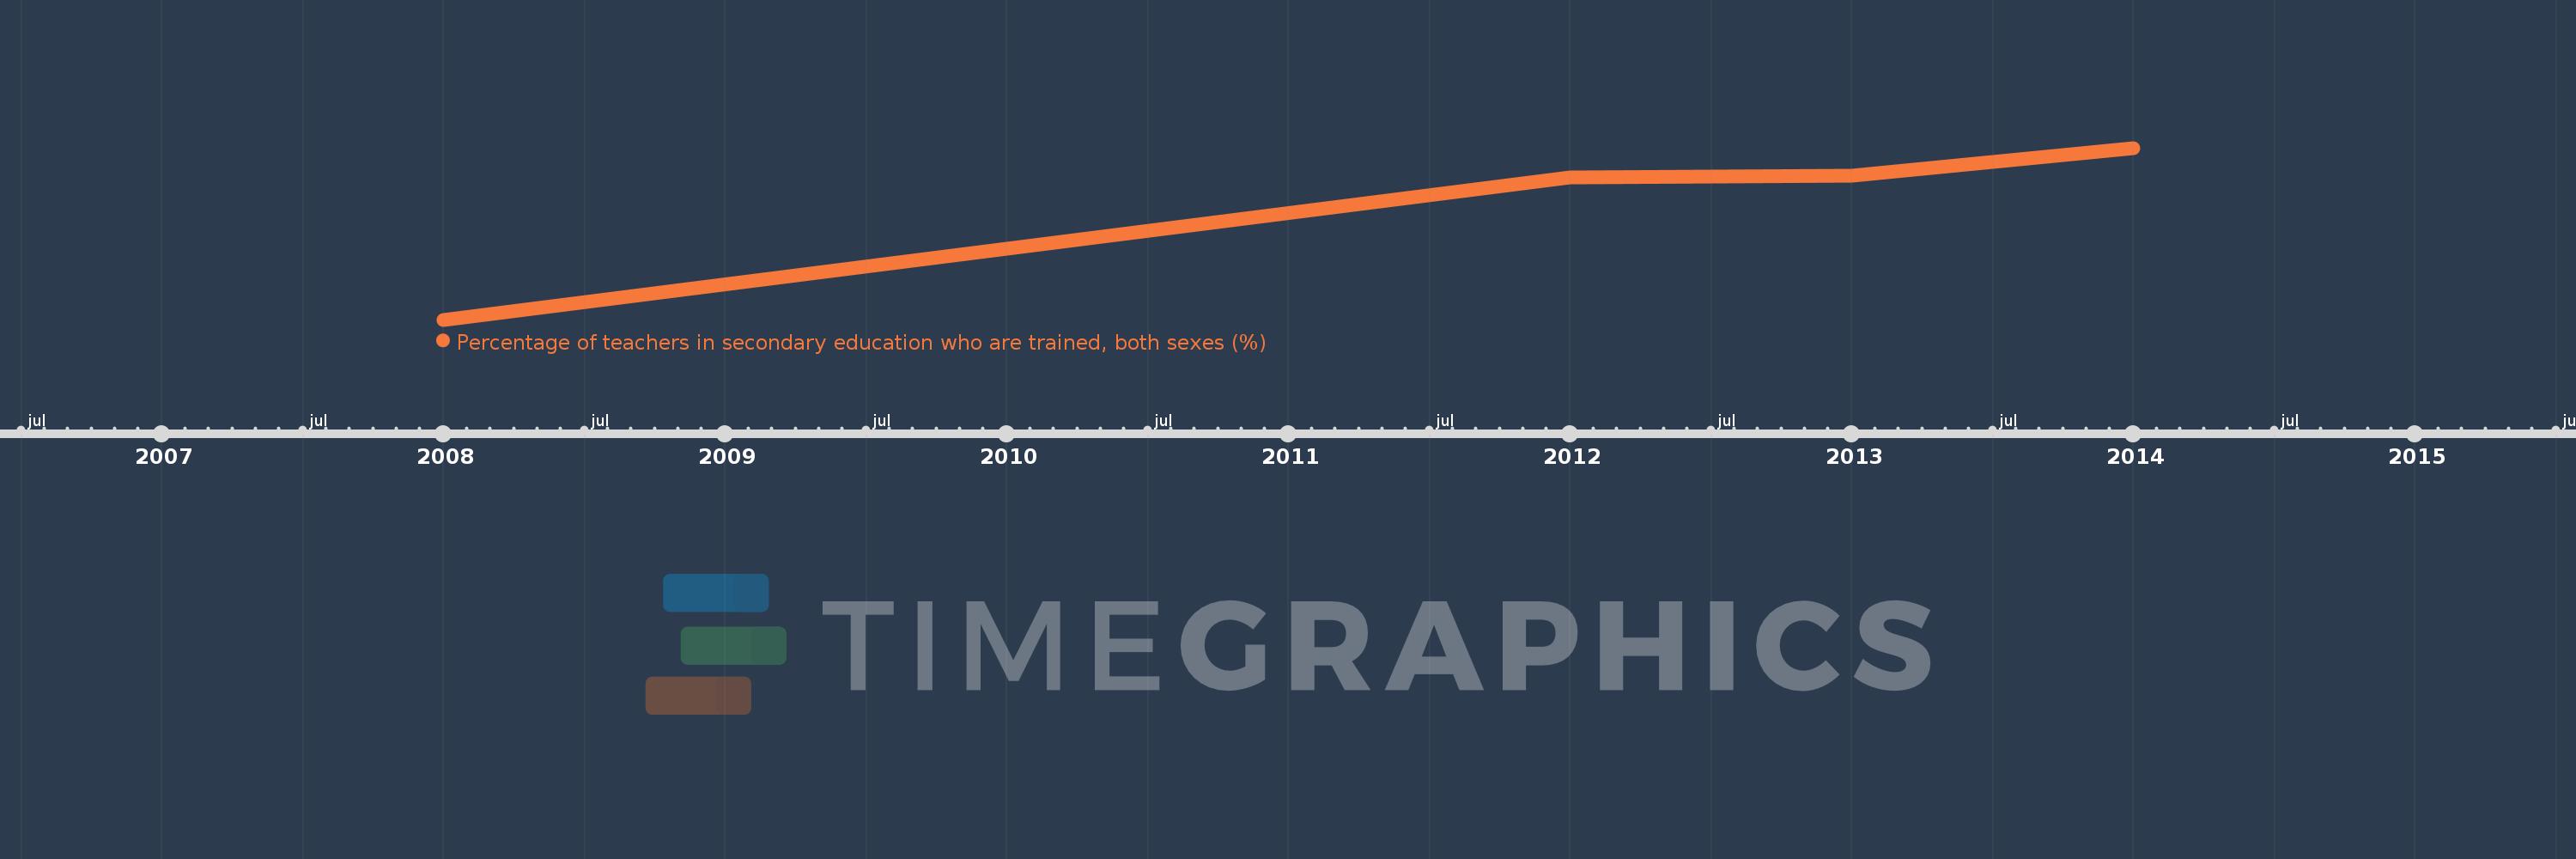
This timeline shows a graph from 2008 to 2014 of Rwanda. No data until 2007. Number of actual observations by date: 4.
Source name:
World Development Indicators
Source organization:
UNESCO Institute for Statistics
Categories, topics:
Education
Last updated:
apr 23, 2017
Indicators value changes by year
Minimum:
53.359
jan 1, 2008
At the date of observation
Value
Absolute change
Change from the previous value
jan 1, 2008
53.359
+53.359
0.0%
jan 1, 2012
82.965
+29.606
55.48%
jan 1, 2013
83.475
+0.511
0.62%
jan 1, 2014
89.17
+5.695
6.82%
Ranking of countries by current statistics by years