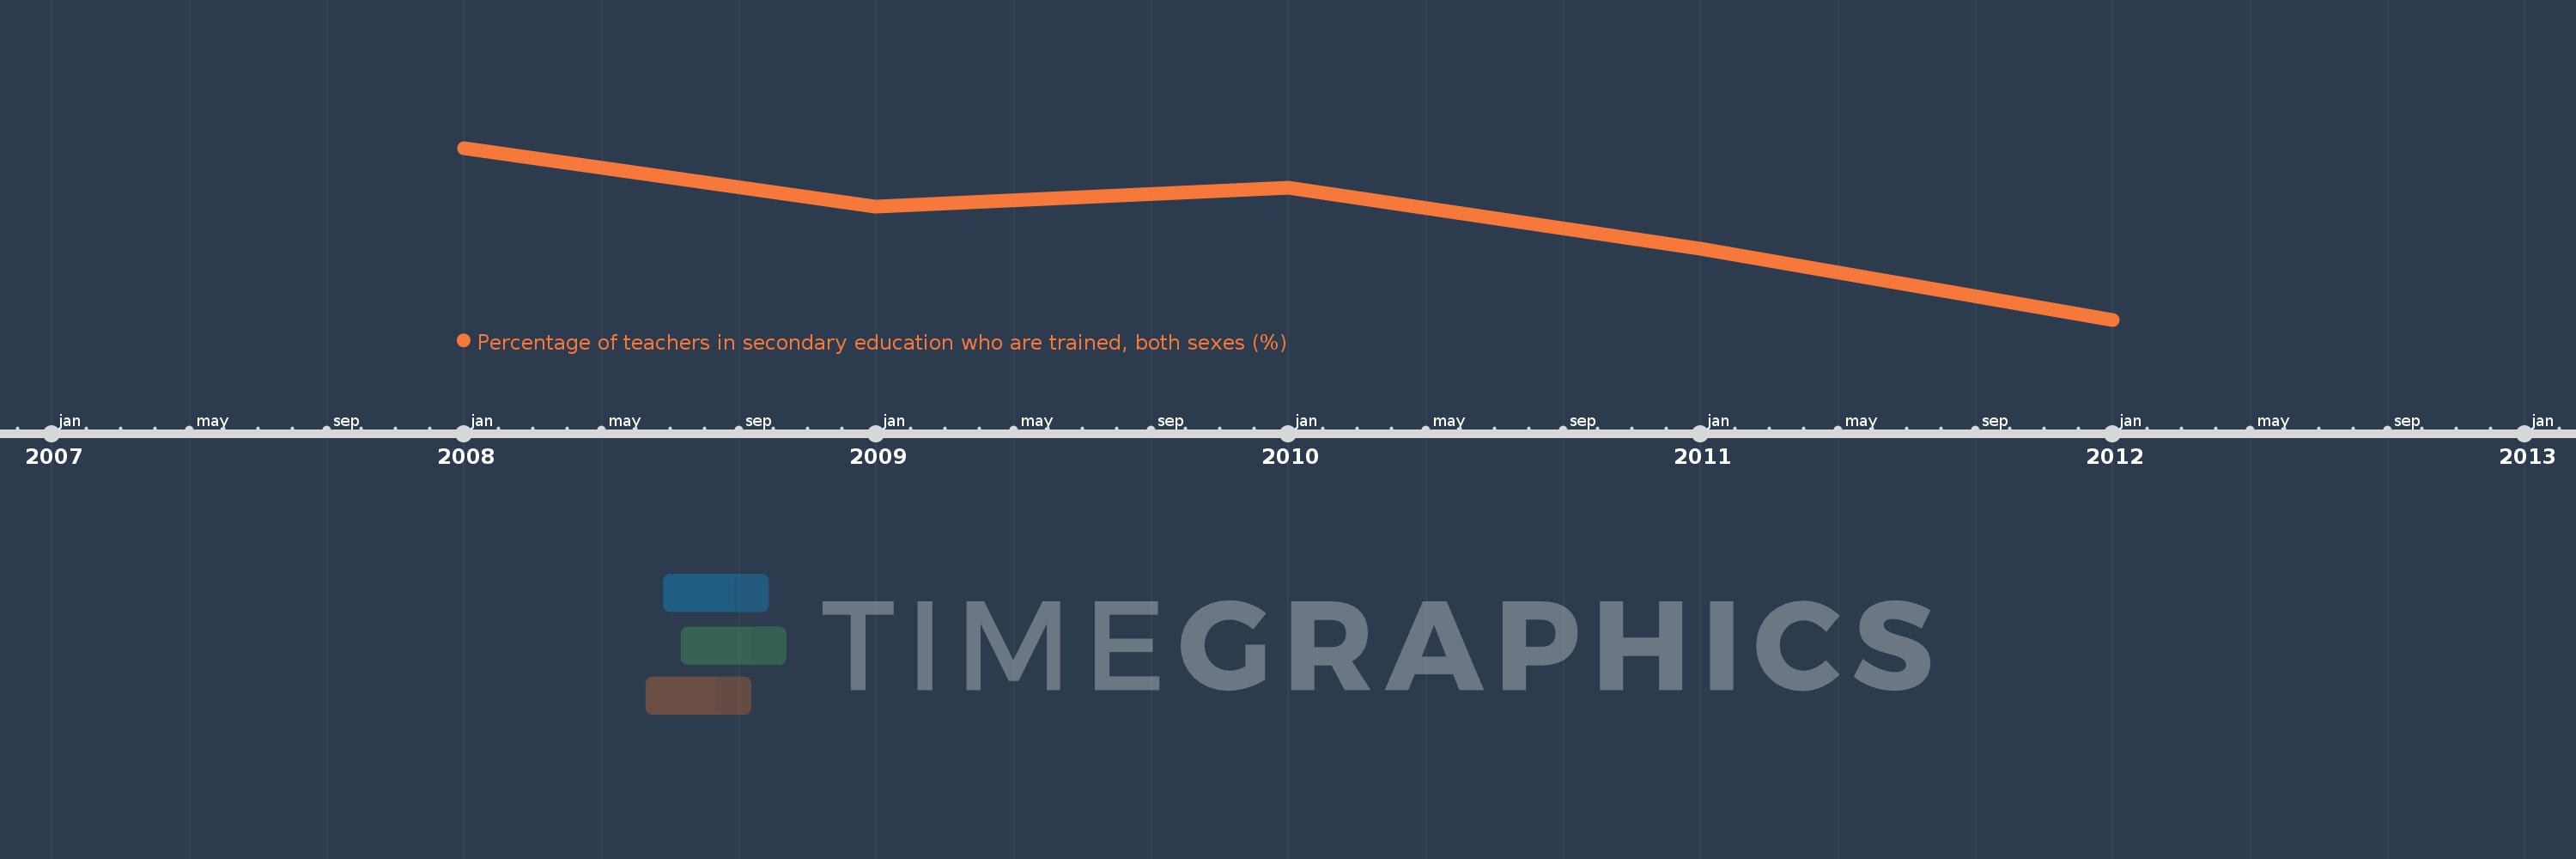
This timeline shows a graph from 2008 to 2012 of Latin America & Caribbean (excluding high income). No data until 2007. Number of actual observations by date: 5.
Source name:
World Development Indicators
Source organization:
UNESCO Institute for Statistics
Categories, topics:
Education
Last updated:
apr 23, 2017
Indicators value changes by year
Meaning:
82.486
Minimum:
81.892
jan 1, 2012
Maximum:
82.94
jan 1, 2008
At the date of observation
Value
Absolute change
Change from the previous value
jan 1, 2008
82.94
+82.94
0.0%
jan 1, 2009
82.58
-0.36
-0.43%
jan 1, 2010
82.696
+0.116
0.14%
jan 1, 2011
82.324
-0.372
-0.45%
jan 1, 2012
81.892
-0.433
-0.53%
Ranking of countries by current statistics by years