Download This statistics in other country:
Timeline:
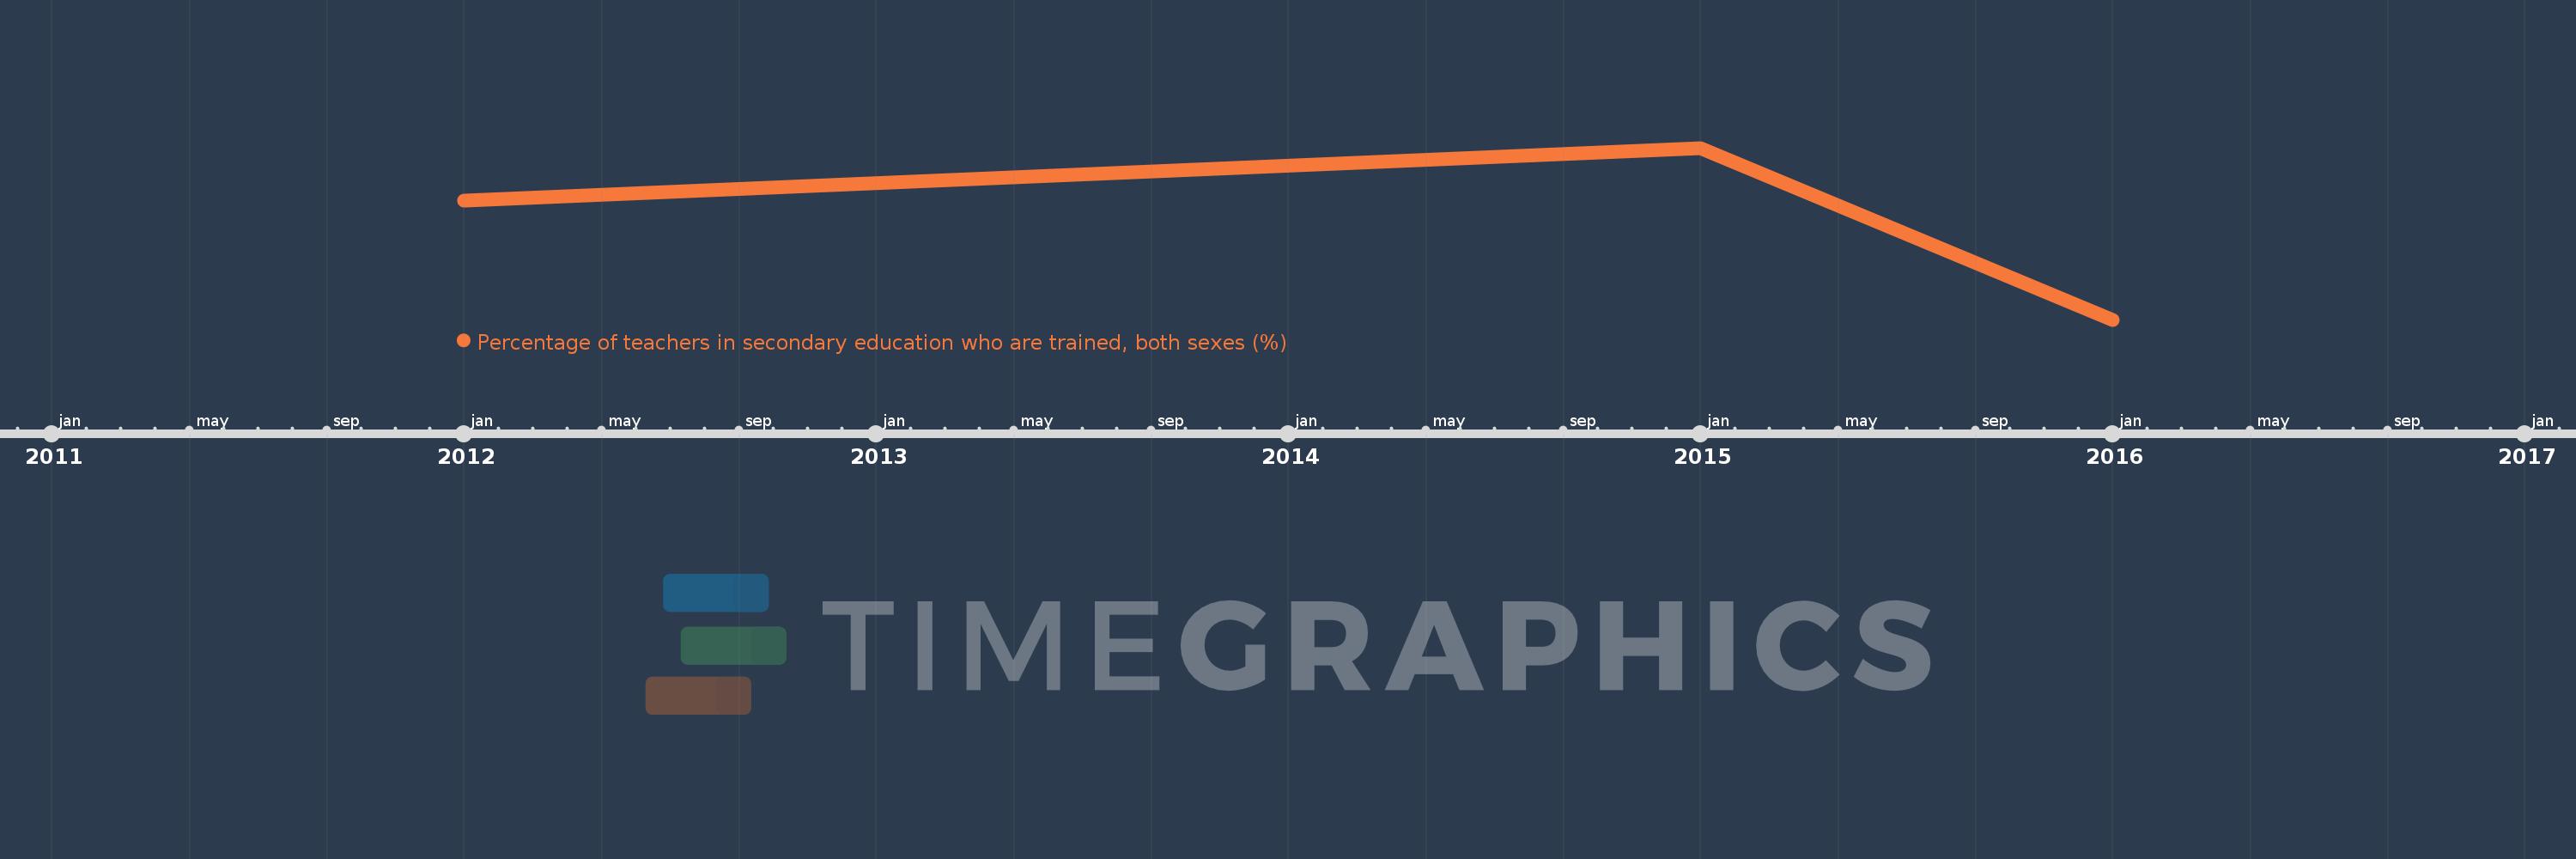
This timeline shows a graph from 2012 to 2016 of Sao Tome and Principe. No data until 2011. Number of actual observations by date: 3.
Source name:
World Development Indicators
Source organization:
UNESCO Institute for Statistics
Categories, topics:
Education
Last updated:
apr 23, 2017
Indicators value changes by year
Minimum:
36.398
jan 1, 2016
Maximum:
48.172
jan 1, 2015
At the date of observation
Value
Absolute change
Change from the previous value
jan 1, 2012
44.592
+44.592
0.0%
jan 1, 2015
48.172
+3.579
8.03%
jan 1, 2016
36.398
-11.774
-24.44%
Ranking of countries by current statistics by years