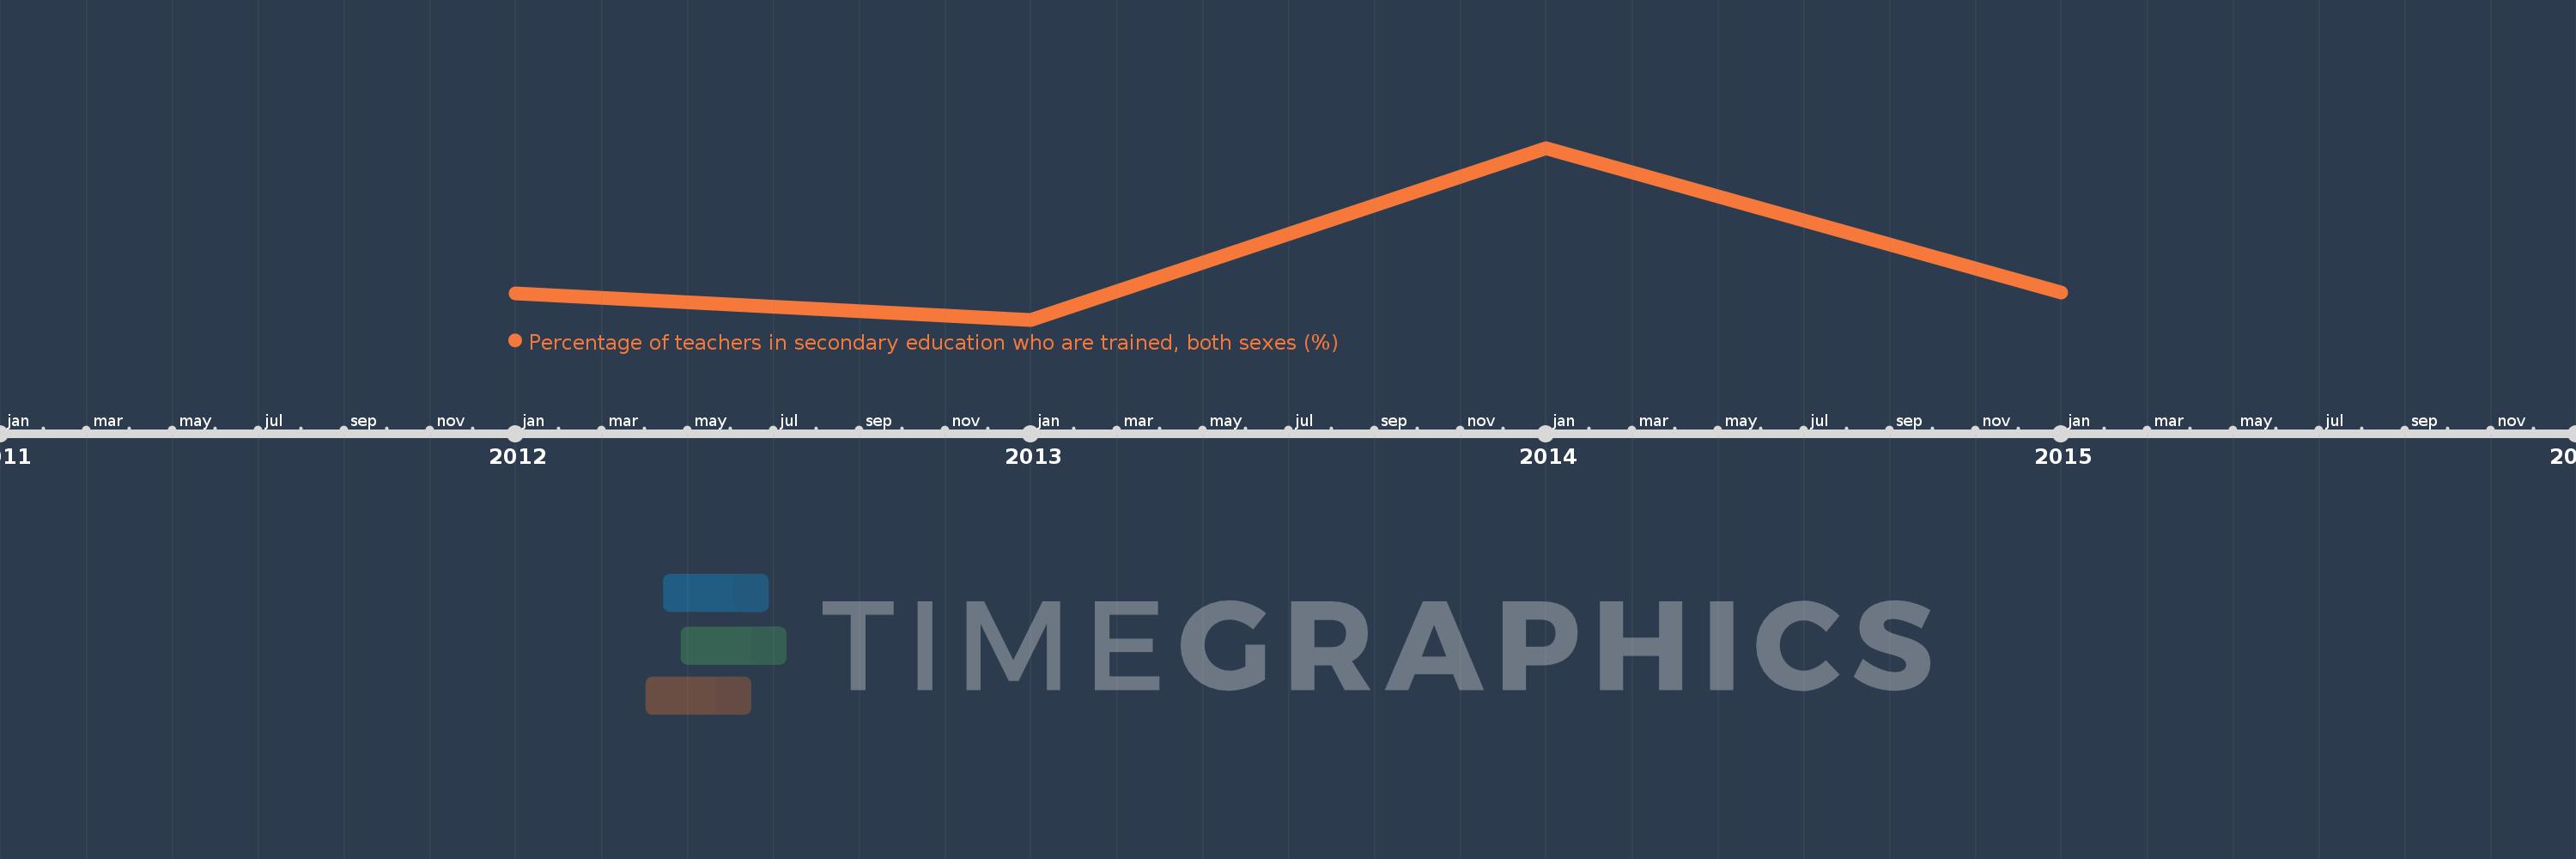
This timeline shows a graph from 2012 to 2015 of Fragile and conflict affected situations. No data until 2011. Number of actual observations by date: 4.
Source name:
World Development Indicators
Source organization:
UNESCO Institute for Statistics
Categories, topics:
Education
Last updated:
apr 23, 2017
Indicators value changes by year
Meaning:
59.945
Minimum:
57.22
jan 1, 2013
Maximum:
65.532
jan 1, 2014
At the date of observation
Value
Absolute change
Change from the previous value
jan 1, 2012
58.476
+58.476
0.0%
jan 1, 2013
57.22
-1.257
-2.15%
jan 1, 2014
65.532
+8.313
14.53%
jan 1, 2015
58.554
-6.978
-10.65%
Ranking of countries by current statistics by years