33
/
AIzaSyB4mHJ5NPEv-XzF7P6NDYXjlkCWaeKw5bc
November 30, 2025
57460
South Asia
SAS
false
2
1
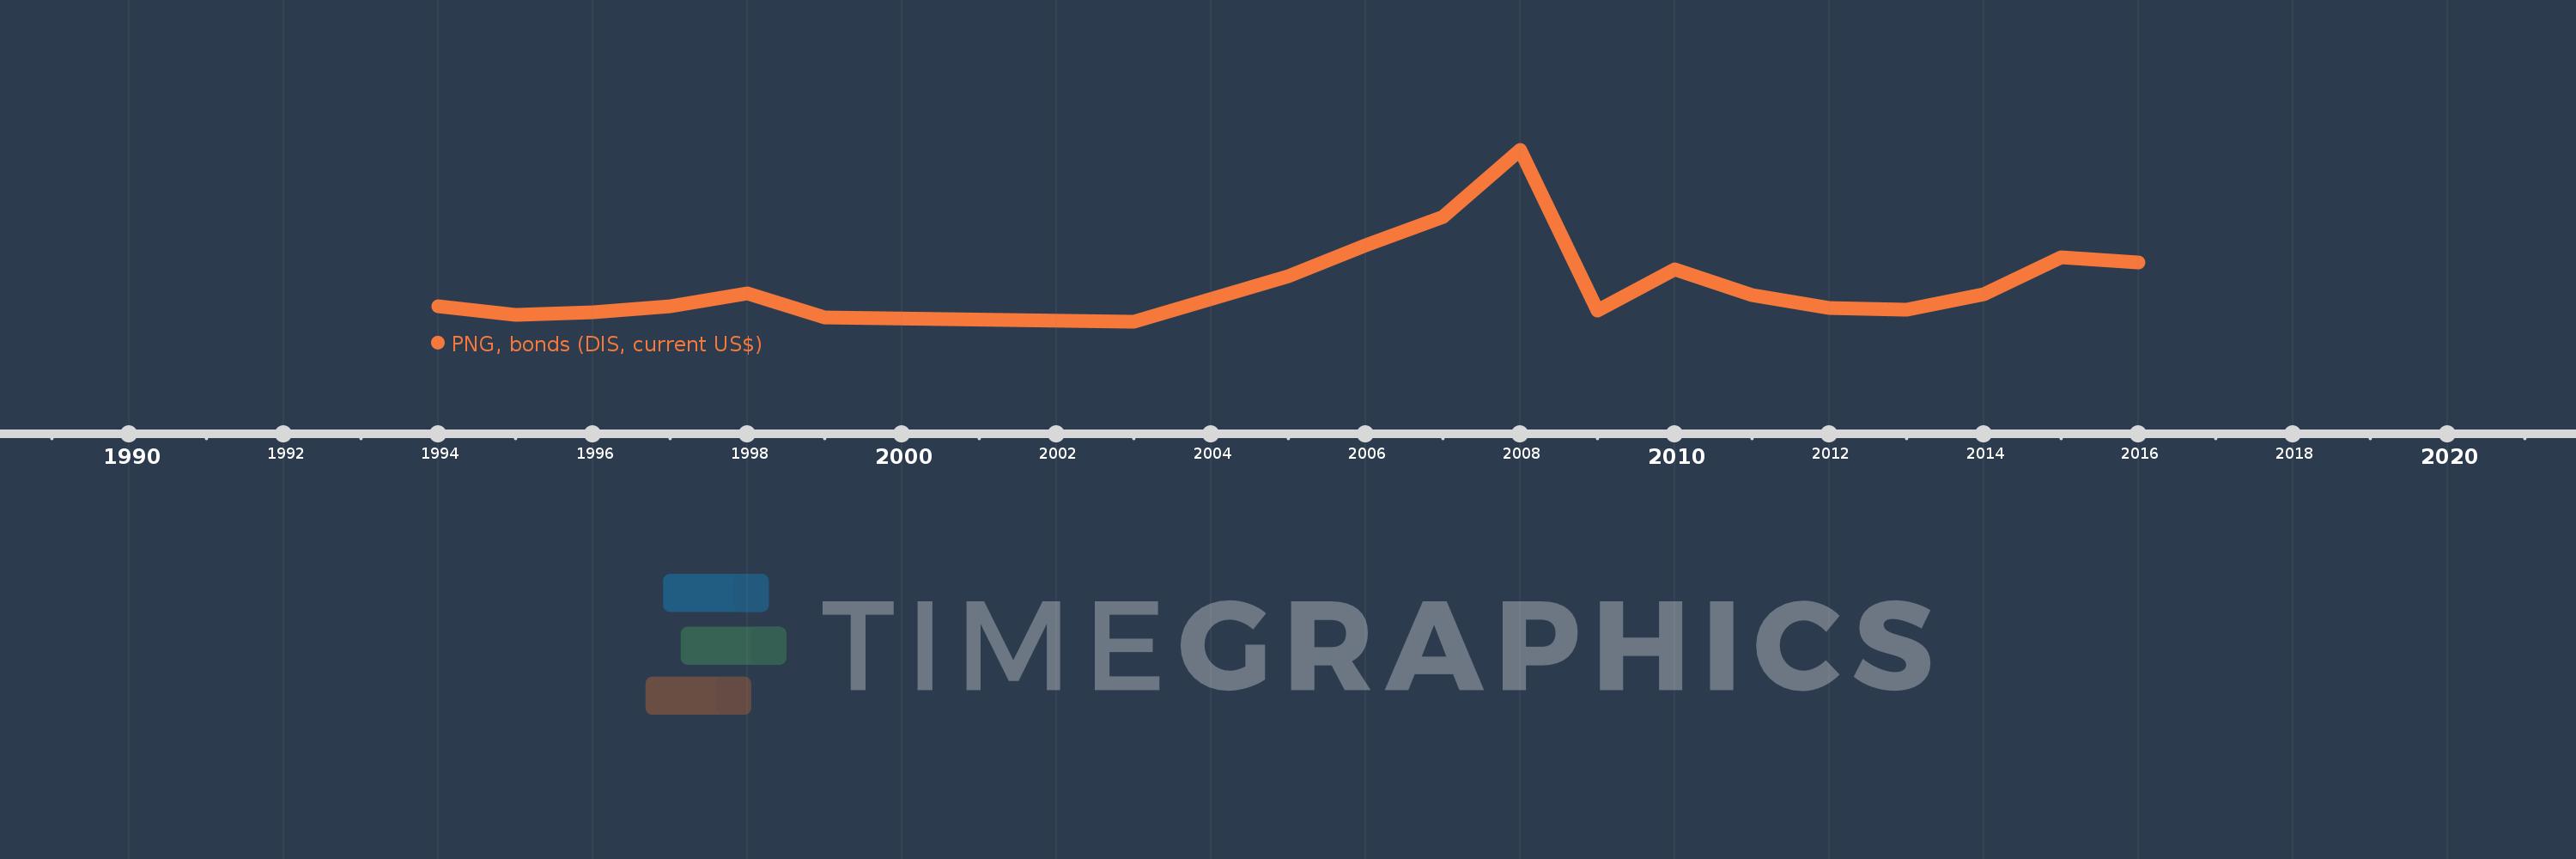
PNG, bonds (DIS, current US$)
2016,2015,2014,2013,2012,2011,2010,2009,2008,2007,2006,2005,2003,1999,1998,1997,1996,1995,1994
Create a timeline
Public Timelines
For education
For educational institutions
For teachers
For students
Cabinet
For educational institutions
For teachers
For students
Open cabinet
FAQ
Close
Create a timeline
Public timelines
FAQ
About & Feedback
Terms
Privacy
FAQ
Support 24/7
Cabinet
Get premium
Donate
Download
Global statistics library
→
South Asia
→
PNG, bonds (DIS, current US$)
This statistics in other country:
Argentina
Armenia
Botswana
Brazil
Bulgaria
China
Colombia
Costa Rica
Dominican Republic
East Asia & Pacific (excluding high income)
Ecuador
Egypt, Arab Rep.
El Salvador
Europe & Central Asia (excluding high income)
Georgia
Ghana
Guatemala
IDA only
India
Indonesia
Jamaica
Kazakhstan
Lao PDR
Latin America & Caribbean (excluding high income)
Lebanon
Low & middle income
Lower middle income
Malaysia
Mexico
Middle East & North Africa (excluding high income)
Middle income
Mongolia
Nigeria
Pakistan
Panama
Paraguay
Peru
Philippines
Romania
Russian Federation
Serbia
South Africa
South Asia
Sri Lanka
Sub-Saharan Africa (excluding high income)
Thailand
Turkey
Ukraine
Upper middle income
Venezuela, RB
Vietnam
Timeline:
This timeline shows a graph from
1994
to
2016
of South Asia. No data until
1993
. Number of actual observations by date:
19
.
Source name:
World Development Indicators
Source organization:
World Bank, International Debt Statistics.
Categories, topics:
External Debt
Last updated:
apr 23, 2017
Indicators value changes by year
Meaning:
1.863 bln
Minimum:
100.0 mln
jan 1, 2003
Maximum:
7.793 bln
jan 1, 2008
At the date of observation
Value
Absolute change
Change from the previous value
jan 1, 1994
794.21 mln
+794.21 mln
0.0%
jan 1, 1995
412.341 mln
-381.869 mln
-48.08%
jan 1, 1996
520.0 mln
+107.659 mln
26.11%
jan 1, 1997
784.976 mln
+264.976 mln
50.96%
jan 1, 1998
1.371 bln
+586.233 mln
74.68%
jan 1, 1999
300.0 mln
-1.071 bln
-78.12%
jan 1, 2003
100.0 mln
-200.0 mln
-66.67%
jan 1, 2005
2.164 bln
+2.064 bln
2.06K%
jan 1, 2006
3.52 bln
+1.357 bln
62.7%
jan 1, 2007
4.799 bln
+1.278 bln
36.32%
jan 1, 2008
7.793 bln
+2.994 bln
62.4%
jan 1, 2009
593.839 mln
-7.199 bln
-92.38%
jan 1, 2010
2.473 bln
+1.88 bln
316.51%
jan 1, 2011
1.288 bln
-1.185 bln
-47.91%
jan 1, 2012
736.66 mln
-551.668 mln
-42.82%
jan 1, 2013
664.667 mln
-71.993 mln
-9.77%
jan 1, 2014
1.336 bln
+670.919 mln
100.94%
jan 1, 2015
2.982 bln
+1.646 bln
123.27%
jan 1, 2016
2.77 bln
-211.609 mln
-7.1%
Ranking of countries by current statistics by years
About & Feedback
Terms
Privacy
FAQ
Support 24/7
Cabinet
Get premium
Donate
The service accepts bank transfer (ACH, Wire) or cards (Visa, MasterCard, etc). Processed by Stripe.
Secured with SSL