33
/
AIzaSyB4mHJ5NPEv-XzF7P6NDYXjlkCWaeKw5bc
November 30, 2025
106425
China
CHN
true
2
1
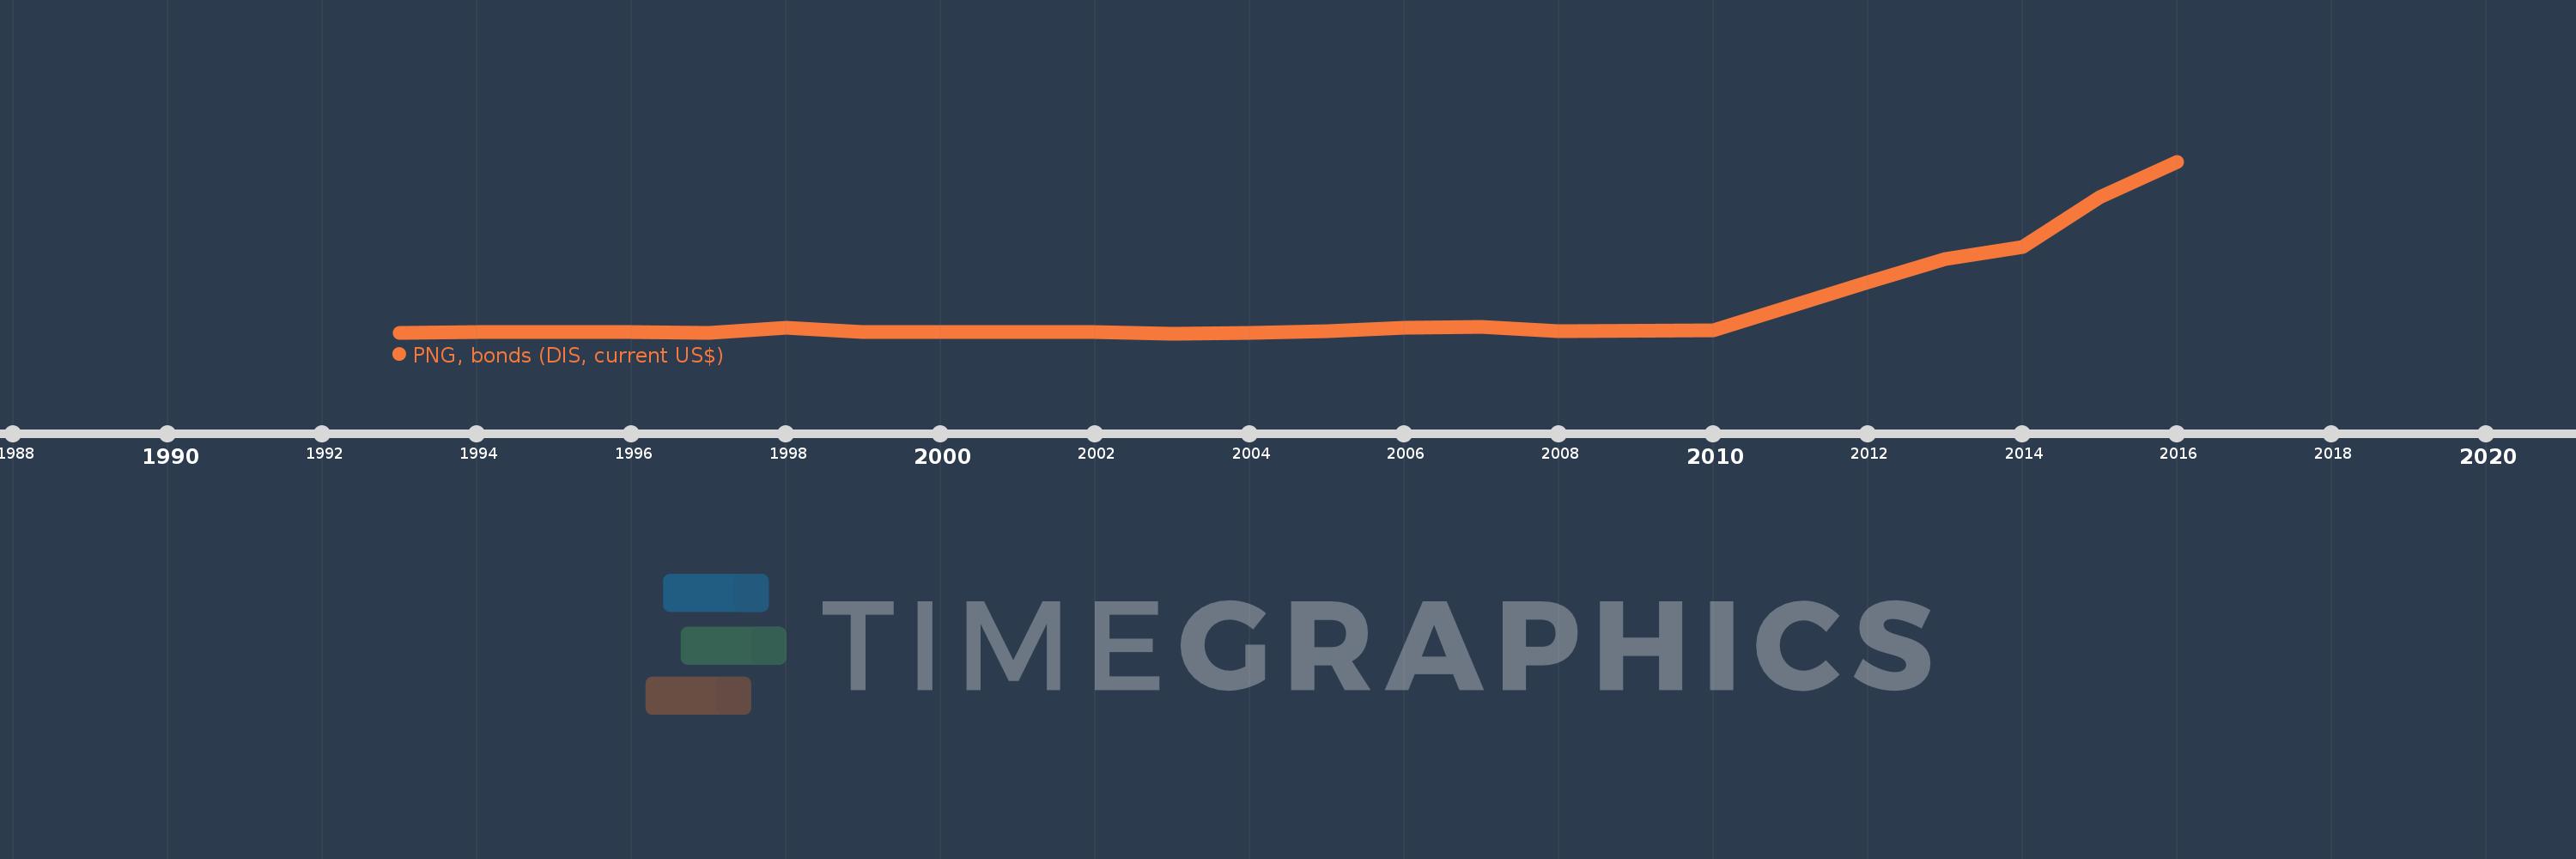
PNG, bonds (DIS, current US$)
2016,2015,2014,2013,2012,2010,2008,2007,2006,2005,2004,2003,2002,2001,1999,1998,1997,1996,1994,1993
Create a timeline
Public Timelines
For education
For educational institutions
For teachers
For students
Cabinet
For educational institutions
For teachers
For students
Open cabinet
FAQ
Close
Create a timeline
Public timelines
FAQ
About & Feedback
Terms
Privacy
FAQ
Support 24/7
Cabinet
Get premium
Donate
Download
Global statistics library
→
China
→
PNG, bonds (DIS, current US$)
This statistics in other country:
Argentina
Armenia
Botswana
Brazil
Bulgaria
China
Colombia
Costa Rica
Dominican Republic
East Asia & Pacific (excluding high income)
Ecuador
Egypt, Arab Rep.
El Salvador
Europe & Central Asia (excluding high income)
Georgia
Ghana
Guatemala
IDA only
India
Indonesia
Jamaica
Kazakhstan
Lao PDR
Latin America & Caribbean (excluding high income)
Lebanon
Low & middle income
Lower middle income
Malaysia
Mexico
Middle East & North Africa (excluding high income)
Middle income
Mongolia
Nigeria
Pakistan
Panama
Paraguay
Peru
Philippines
Romania
Russian Federation
Serbia
South Africa
South Asia
Sri Lanka
Sub-Saharan Africa (excluding high income)
Thailand
Turkey
Ukraine
Upper middle income
Venezuela, RB
Vietnam
Timeline:
This timeline shows a graph from
1993
to
2016
of China. No data until
1992
. Number of actual observations by date:
20
.
Source name:
World Development Indicators
Source organization:
World Bank, International Debt Statistics.
Categories, topics:
External Debt
Last updated:
apr 23, 2017
Indicators value changes by year
Meaning:
7.721 bln
Minimum:
90.0 mln
jan 1, 2003
Maximum:
47.61 bln
jan 1, 2016
At the date of observation
Value
Absolute change
Change from the previous value
jan 1, 1993
197.575 mln
+197.575 mln
0.0%
jan 1, 1994
332.0 mln
+134.425 mln
68.04%
jan 1, 1996
543.889 mln
+211.889 mln
63.82%
jan 1, 1997
128.786 mln
-415.103 mln
-76.32%
jan 1, 1998
1.518 bln
+1.389 bln
1.08K%
jan 1, 1999
469.0 mln
-1.049 bln
-69.1%
jan 1, 2001
390.0 mln
-79.0 mln
-16.84%
jan 1, 2002
475.647 mln
+85.647 mln
21.96%
jan 1, 2003
90.0 mln
-385.647 mln
-81.08%
jan 1, 2004
175.0 mln
+85.0 mln
94.44%
jan 1, 2005
736.915 mln
+561.915 mln
321.09%
jan 1, 2006
1.622 bln
+885.23 mln
120.13%
jan 1, 2007
1.945 bln
+322.855 mln
19.9%
jan 1, 2008
740.0 mln
-1.205 bln
-61.95%
jan 1, 2010
925.0 mln
+185.0 mln
25.0%
jan 1, 2012
14.189 bln
+13.264 bln
1.43K%
jan 1, 2013
20.703 bln
+6.515 bln
45.91%
jan 1, 2014
23.897 bln
+3.193 bln
15.42%
jan 1, 2015
37.74 bln
+13.843 bln
57.93%
jan 1, 2016
47.61 bln
+9.87 bln
26.15%
Ranking of countries by current statistics by years
About & Feedback
Terms
Privacy
FAQ
Support 24/7
Cabinet
Get premium
Donate
The service accepts bank transfer (ACH, Wire) or cards (Visa, MasterCard, etc). Processed by Stripe.
Secured with SSL