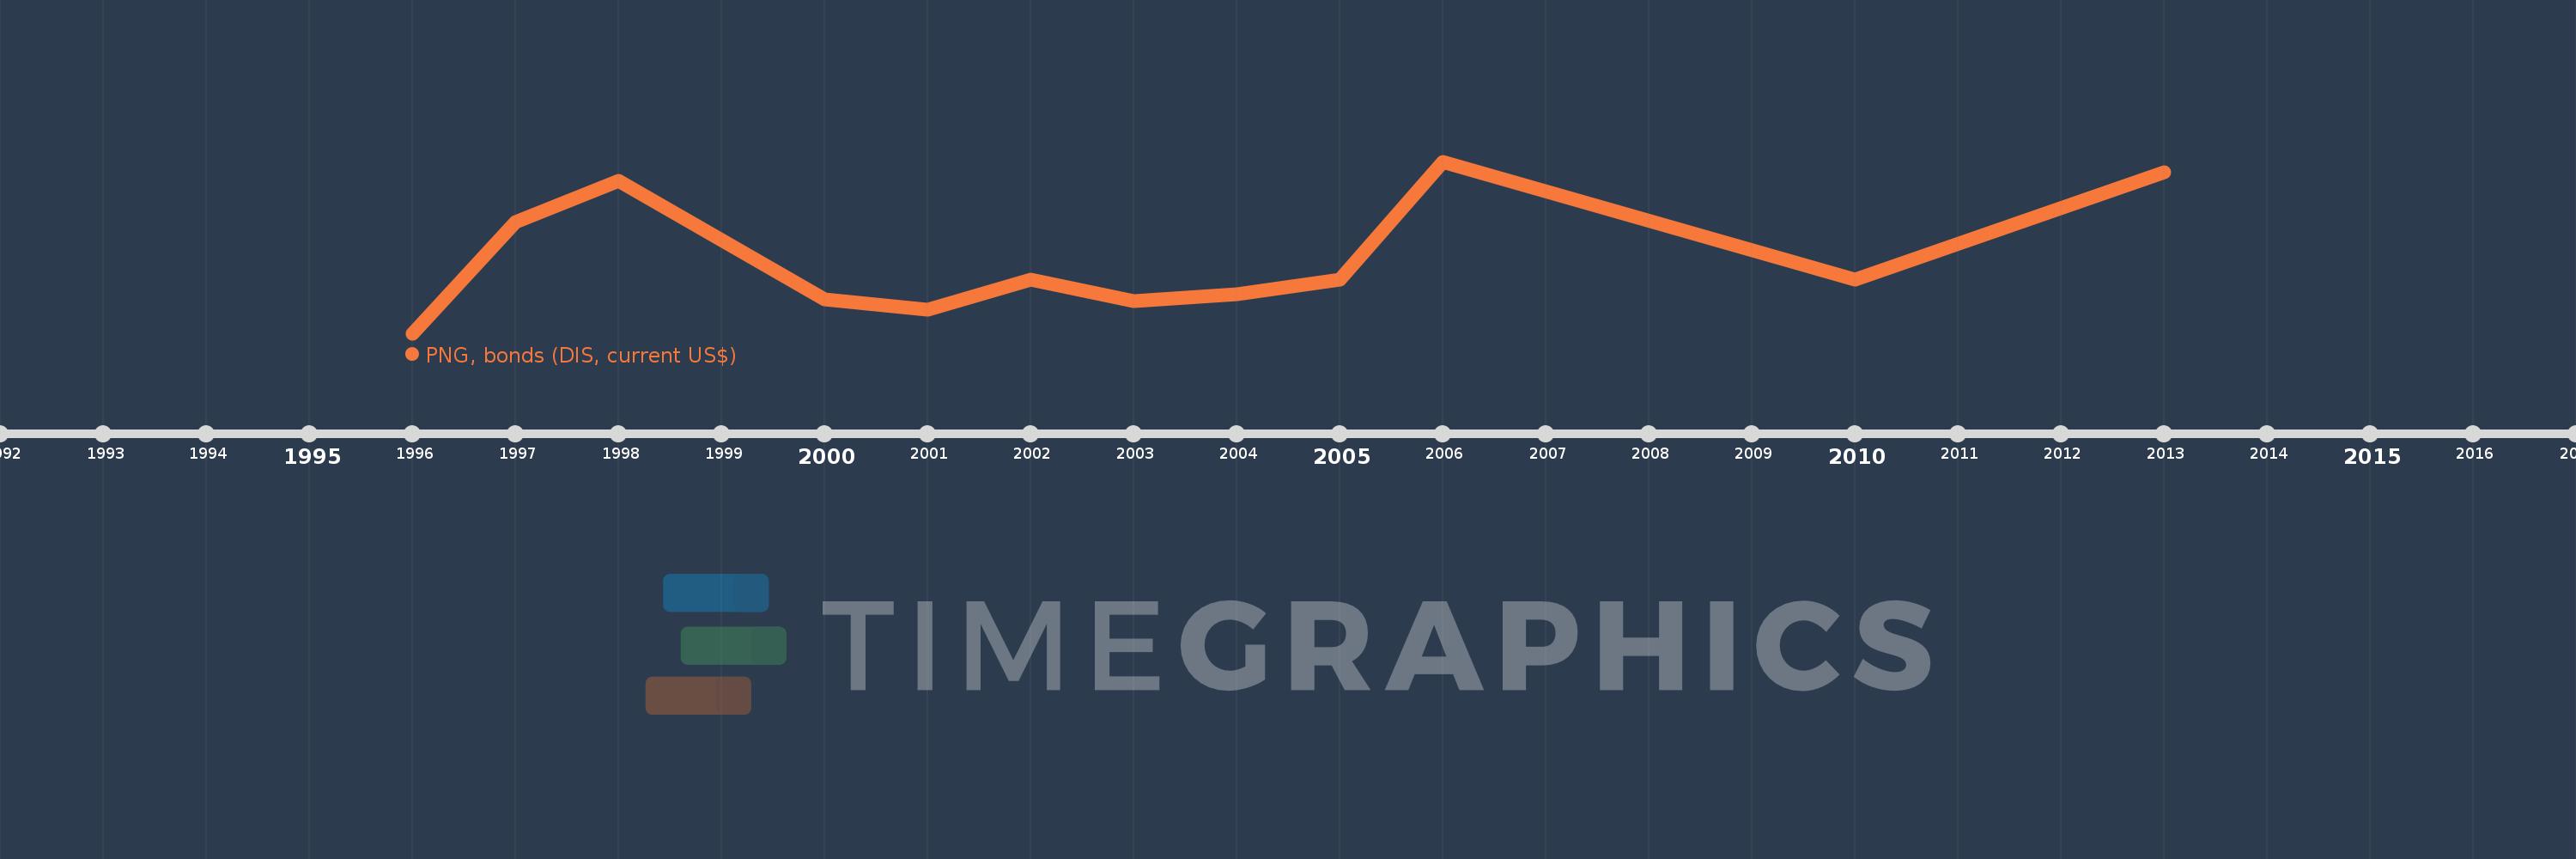
This timeline shows a graph from 1996 to 2013 of Middle East & North Africa (excluding high income). No data until 1995. Number of actual observations by date: 12.
Source name:
World Development Indicators
Source organization:
World Bank, International Debt Statistics.
Categories, topics:
External Debt
Last updated:
apr 23, 2017
Indicators value changes by year
Meaning:
256.333 mln
Minimum:
50.0 mln
jan 1, 1996
Maximum:
530.0 mln
jan 1, 2006
At the date of observation
Value
Absolute change
Change from the previous value
jan 1, 1996
50.0 mln
+50.0 mln
0.0%
jan 1, 1997
360.0 mln
+310.0 mln
620.0%
jan 1, 1998
475.0 mln
+115.0 mln
31.94%
jan 1, 2000
146.0 mln
-329.0 mln
-69.26%
jan 1, 2001
115.0 mln
-31.0 mln
-21.23%
jan 1, 2002
200.0 mln
+85.0 mln
73.91%
jan 1, 2003
140.0 mln
-60.0 mln
-30.0%
jan 1, 2004
160.0 mln
+20.0 mln
14.29%
jan 1, 2005
200.0 mln
+40.0 mln
25.0%
jan 1, 2006
530.0 mln
+330.0 mln
165.0%
jan 1, 2010
200.0 mln
-330.0 mln
-62.26%
jan 1, 2013
500.0 mln
+300.0 mln
150.0%
Ranking of countries by current statistics by years